Search

Showing posts with label Software. Show all posts

Tuesday, May 05, 2020

Using Visual Studio Codespaces


One of the pain points we face with remote development is having to go through few extra hops to get to our virtual dev boxes. Many of us uses Azure VMs for development (in addition to local machines) and our security policy is to lock down all VMs to our Microsoft corporate network.

So to ssh or rdp into an Azure VM for development, we first connect over VPN to corporate network, then use a corpnet machine to then login to the VMs. That is painful and more so now when we are working remotely.

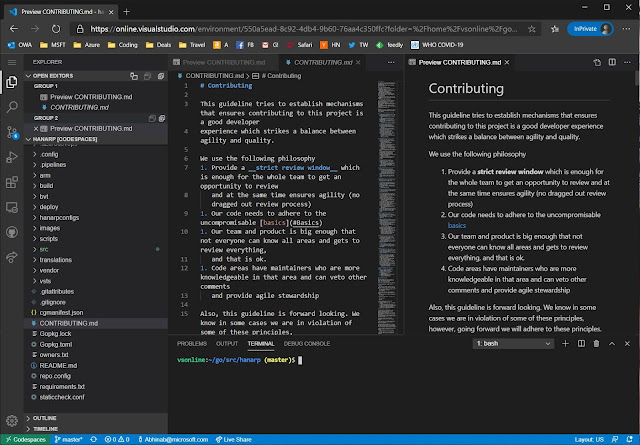
This is  where the newly announced Visual Studio Codespaces come in. Basically it is a hosted vscode in the cloud. It runs beautifully inside a browser and best of all comes with full access to the linux shell underneath. Since it is run as a service and secured by the Microsoft team building it, we can simply use it from a browser on any machine (obviously over two-factor authentication).

At the time of writing this post, the cost is around $0.17 per hour for 4 core/8GB which brings the price to around $122 max for the whole month. Codespaces also has a snooze feature. I use snooze after one hour of no usage. This does mean additional startup time when you next login, but saves even more money. In between snooze the state of the box is retained.


While just being able to use the IDE on our code base is cool in itself, having access to the shell underneath is even cooler. Hit Ctrl+` in vscode to bring up the terminal window.


I then sync'd my linux development environment from https://github.com/abhinababasu/share, installed required packages that I need. Finally I have a full shell and IDE in the cloud, just the way I want it.

To try out Codespaces head to https://aka.ms/vso-login

Monday, February 17, 2020

System Engineering Guidelines


While building our system that powers memory intensive compute in Azure we use the following engineering guidelines. We use these guidelines to build our BareMetal resource provider, cluster manager etc. These are useful principles we have accumulated from experience building various systems. What other principles do you use and recommend including?
  1. Close on broad design before sending PRs.
    1. Add design as markdown to root of the feature code path and discuss it as a PR. For broad cross RP feature it is ok to place it in the root
    2. For sizable features please have a design meeting
    3. Requirement for a design meeting is to send a pre-read and expectation is all attendees have reviewed the pre-read before coming in
  2. Be aware of distributed system quirks
    1. Think CAP theorem. This is a distributed system, network partition will occur, be explicit about your availability and consistency model in that event
    2. All remote calls will fail, have re-tries that uses exponential back-off. Log warning on re-tries and error if it finally fails
    3. Ensure we always have consistent state. There should be only 1 authoritative version of truth. Having local data that is eventually consistent with this truth is acceptable. Know the max time-period for eventual consistency
  3. System needs to be reliable, scalable and fault tolerant
    1. Always avoid SPOF (Single Point of Failure), even for absolutely required resources like SQLServer consider retrying (see below), gracefully fail and recover
    2. Have retries
    3. APIs need to be responsive and return in sub second for most scenarios. If something needs to take longer, immediately return with a mechanism to track progress on the background job started
    4. All API and actions we support should have a 99.9 uptime/success SLA. Shoot for 99.95
    5. Our system should be stateless (have state elsewhere in data-store) and designed to be cattle and not pets
    6. Systems should be horizontally scalable. We should be able to simply add more nodes to a cluster to handle more traffic
    7. Choose to use a managed service over attempting to build it or deploy it in-house
  4. Treat configuration as code
    1. Breaks due to out of band config changes are too common. So consider config deployment the same way as code deployment (Use SCD == Safe Config/Code Deployment)
    2. Config should be centralized. Engineers shouldn't be hunting around to look for configs
  5. All features must have feature flag in config.
    1. The feature flag can be used to disable features in per region basis
    2. Once a feature flag is disabled the feature should cause no impact to the system
  6. Try to make sure your system works on a single boxThis makes dev-test significantly easier. Mocking auxiliary systems is OK
  7. Never delete things immediately
    1. Don't delete anything instantaneously, especially data. Tombstone deleted data away from user view
    2. Keep data, metadata, machines around for a garbage collector to periodically delete at configurable duration.
  8. Strive to be event driven
    1. Polling is bad as the primary mechanism
    2. Start with event driven approach and have fallback polling
  9. Have good unit tests.
    1. All functionality needs to ship with tests in the same PR (no test PR later)
    2. Unit test tests functionality of units (e.g. class/modules)
    3. They do not have to test every internal functions. Do not write tests for tests' sake. If test covers all scenarios exposed by an unit, it is OK to push back on comments like "test all methods".
    4. Think what does your unit implement and can the test validate the unit is working after any changes to it
    5. Similarly if you add a reference to an unit from outside and depend on a behavior consider adding a test to the callee so that changes to that unit doesn’t break your requirements
    6. Unit test should never call out from dev box, they should be local tests only
    7. Unit test should not require other things to be spun up (e.g. local SQL server)
  10. Consider adding BVT to scenarios that cannot be tested in unit tests.
    E.g. stored procs need to run against real SqlDB deployed in a container during BVT, or test query routing that needs to run inside a web-server
  11. All required tests should be automatically run and not require humans to remember to run them
  12. Test in production via our INT/canary clusterSomethings simply cannot be tested on dev setup as they rely on real services to be up. For these consider testing in production over our INT infra.
    1. All merges are automatically deployed to our INT cluster
    2. Add runners to INT that simulate customer workloads.
    3. Add real lab devices or fake devices that test as much as possible. E.g. add fake snmp trap generator to test fluentd pipeline, have real blades that can be rebooted using our APIs periodically
    4. Bits are then deployed to Canary clusters where there are real devices being used for internal testing, certification. Bake bits in Canary!
  13. All features should have measurable KPIs and metrics.
    1. You must add metrics against new features. Metrics should tell how well your feature is working, if your feature stops working or if any anomaly is observed
    2. Do not skimp on metrics, we can filter metrics on the backend rather than not having them fired
  14. Copious logging is required.
    1. Process should never fail silently
    2. You must add logs for both success and failure paths. Err on the side of too much logging
  15. Do not rely on text logs to catch production issues.
    1. You cannot rely on too many error logs from a container to catch issues. Have metrics instead (see above)
    2. Logs are a way to root-cause and debug and not catch issues
  16. Consider on-call for all development
    1. Ensure you have metrics and logs
    2. Ensure you write good documentation that anyone in the team can understand without tons of context
    3. Add alerts with direct link to TSGs
    4. Add actionable alerts where the on-call can quickly mitigate
    5. On-call should be able to turn off specific features in case it is causing problems in production
    6. All individual merges can be rolled back. Since you cannot control when code snap for production happens the PRs should be such that it can be individually rolled back

Sunday, November 13, 2016

Magic Mirror

I just implemented a MagicMirror for our home. Video footage of it working.

Basically I used the open source http://github.com/MichMich/MagicMirror. I had to do a few changes. I added a hideall module  so that everything is hidden and comes visible on detecting motion. My sources are at https://github.com/bonggeek/hideall

This is the first prototype working on desk monitor with a 1mm two-way mirror held in front of it.

20161101_014220

It was evident that the thin 1mm acrylic mirror is no good, because it bent easily giving weird distorted images. I moved to a 3mm 36” by 18” mirror and started working on a good sturdy frame.

20161105_154428_Richtone(HDR)20161105_154503_Richtone(HDR)

20161105_160518

I used 3x1 wood for the size which is actually 2.5 x 0.75 inches. On that I placed a face-frame.

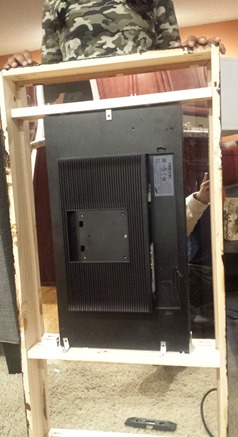
I had a smaller 27” old monitor and decided to just use that. I mounted and braced the monitor with L shaped brackets. So it is easy to take out as well as hold the monitor firmly in place.

20161107_163647

Final pictures

IMG_8263IMG_8252IMG_8253

Wednesday, October 21, 2015

How to add a breakpoint in a managed generic method in windbg (sos)

Milkyway over Mt. Rainier

This is not really a blog post but a micro-post. Someone asked me and since I couldn’t find any post out there calling it out, thought I’d add

If you want to add a breakpoint to a managed method inside windbg using sos extension, the obvious way is to use the extension command !bpmd. However, if the target method is generic or inside a generic type it is slightly tricky, you don’t use <T> but rather `<count of generic types>

So I have a the following inside by foo.exe managed app

namespace Abhinaba
{
public class PriorityThreadPool<t> : IDisposable
{
public bool RunTask(T param, Action<t> action)
{
// cool stuff
}
}
}

To set breakpoint in it I use the following (notice the red highlighted part)

!bpmd ApplicationHost.exe Xap.ApplicationHost.PriorityThreadPool`1.RunTask

Monday, September 29, 2014

.NET Just in Time Compilation and Warming up Your System

IMG_7823.jpg

One of the primary obstacle we face while scaling our system is Just In Time (JIT) compilation of the .NET stack. We run a .NET managed application server at a huge scale with many thousands of managed assemblies on each server (and many many thousands of those servers distributed globally).We deploy code daily and since those are managed code they are JITed at each deployment. Our system is very sensitive to latency and we do not want those servers getting new code to cost us execution latency. So we use various mechanisms to warm the servers before they start serving queries. Common techniques we use are

  1. NGEN
  2. Force JITing (a specialized multi-core JIT technique see bottom of post)
  3. Sending warmer queries that warm up the system

In this effort I frequently handle questions regarding how the system JITs managed methods. Even after so many years of the CLR JIT existing there seems to be confusion around when JIT happens, what is the unit of compilation. So I thought I’d make a quick post on this topic.

Consider the following simple code I have in One.cs

using System;

namespace Foo
{
class MyClass
{
public void a()
{
int i = 0;
while(true)
{
b(i++);
}
}

public void b(int i)
{
Console.WriteLine(i);
}
}

class Program
{
static void Main()
{
MyClass mc = new MyClass();
mc.a();
}
}
}


Of interest is the function Foo.MyClass.a and Foo.MyClass.b. We will debug to find out exactly when the later is JITed.


First I compile and then launch the debugger. I will use the windbg debugger and the sos extensions extensively in this post. Also read https://support2.microsoft.com/kb/319037?wa=wsignin1.0 to see how to setup symbol servers to debug into the CLR.

csc /debug+ One.cs
windbg one.exe


After that in windbg I run the following command to setup

.sympath+ d:\MySymbols          ;$$ Use the Microsoft symbol server (see link above)
sxe ld:clr ;$$ break on CLR loaded
g ;$$ continue the program until you break on CLR.dll being loaded
.loadby sos clr ;$$ load the sos debugger extension

!bpmd One.exe Foo.MyClass.a ;$$ Set a managed break point in a()
g ;$$ continue until break point in a() is hit


When this break point is hit, we have obviously already JITed MyClass.a() and executing it. The question we now have is that whether all the functions a() calls like MyClass.b() already JITed. If not when/how will that be JITed. Lets debug it!!


**Color coding indicates how I take output of one command to give inputs to the next one.


First lets find the this pointer for the MyClass instance. This can be obtained from the current managed call stack

0:000> !clrstack -a
PARAMETERS:
this (0x0000000000d9eea0) = 0x0000000002922c58


The details of the this object shows the MethodTable for it. The MethodTable has pointer to EEClass (cold data).

0:000> !do 0x0000000002922c58
Name: Foo.MyClass
MethodTable: 00007ffab2f640d8
EEClass: 00007ffab3072340
Size: 24(0x18) bytes
File: d:\Skydrive\Code\C#\_JITPresentation\One.exe
Fields:


Now we can see more details of the MethodTable, which will show the individual methods descriptors.

0:000> !dumpmt -md 00007ffab2f640d8
EEClass: 00007ffab3072340
Module: 00007ffab2f62fc8
Name: Foo.MyClass
mdToken: 0000000002000002
File: d:\Skydrive\Code\C#\_JITPresentation\One.exe
BaseSize: 0x18
ComponentSize: 0x0
Slots in VTable: 7
Number of IFaces in IFaceMap: 0
--------------------------------------
MethodDesc Table
Entry MethodDesc JIT Name
00007ffb07c16300 00007ffb077c80e8 PreJIT System.Object.ToString()
00007ffb07c5e760 00007ffb077c80f0 PreJIT System.Object.Equals(System.Object)
00007ffb07c61ad0 00007ffb077c8118 PreJIT System.Object.GetHashCode()
00007ffb07c5eb50 00007ffb077c8130 PreJIT System.Object.Finalize()
00007ffab3080120 00007ffab2f640d0 JIT Foo.MyClass..ctor()
00007ffab3080170 00007ffab2f640b0 JIT Foo.MyClass.a()
00007ffab2f6c050 00007ffab2f640c0 NONE Foo.MyClass.b(Int32)


The type has 7 methods. Also the out clearly indicates that Foo.MyClass.a() is JITed and Foo.MyClass.b() is NONE (or not JITed). We can get more details about these methods

0:000> !dumpmd 00007ffab2f640b0
Method Name: Foo.MyClass.a()
Class: 00007ffab3072340
MethodTable: 00007ffab2f640d8
mdToken: 0000000006000001
Module: 00007ffab2f62fc8
IsJitted: yes
CodeAddr: 00007ffab3080170 <----- JITed
Transparency: Critical
i. 0:000> !dumpmd 00007ffab2f640c0
Method Name: Foo.MyClass.b(Int32)
Class: 00007ffab3072340
MethodTable: 00007ffab2f640d8
mdToken: 0000000006000002
Module: 00007ffab2f62fc8
IsJitted: no
CodeAddr: ffffffffffffffff <----- Not yet JITed


So at this point we know that a() is JITed but the method b() it calls is not. In that the question arises that if it is not what is the content of the native instructions for a() and what does that code call into for b(). The disassembly will clearly show that the entire method a() is JITed and that for outward managed calls there are calls to stubs

0:000> u 00007ffab3080170 L24
One!Foo.MyClass.a() [d:\Skydrive\Code\C#\_JITPresentation\One.cs @ 8]:
00007ffa`b3080170 48894c2408 mov qword ptr [rsp+8],rcx
00007ffa`b3080175 4883ec38 sub rsp,38h
00007ffa`b3080179 c744242000000000 mov dword ptr [rsp+20h],0
00007ffa`b3080181 c644242400 mov byte ptr [rsp+24h],0
00007ffa`b3080186 48b83834f6b2fa7f0000 mov rax,7FFAB2F63438h
00007ffa`b3080190 8b00 mov eax,dword ptr [rax]
00007ffa`b3080192 85c0 test eax,eax
00007ffa`b3080194 7405 je One!Foo.MyClass.a()+0x2b (00007ffa`b308019b)
00007ffa`b3080196 e82574b25f call clr!JIT_DbgIsJustMyCode (00007ffb`12ba75c0)
00007ffa`b308019b 90 nop
00007ffa`b308019c c744242000000000 mov dword ptr [rsp+20h],0
00007ffa`b30801a4 eb23 jmp One!Foo.MyClass.a()+0x59 (00007ffa`b30801c9)
00007ffa`b30801a6 90 nop
00007ffa`b30801a7 8b4c2420 mov ecx,dword ptr [rsp+20h]
00007ffa`b30801ab ffc1 inc ecx
00007ffa`b30801ad 8b442420 mov eax,dword ptr [rsp+20h]
00007ffa`b30801b1 89442428 mov dword ptr [rsp+28h],eax
00007ffa`b30801b5 894c2420 mov dword ptr [rsp+20h],ecx
00007ffa`b30801b9 8b542428 mov edx,dword ptr [rsp+28h]
00007ffa`b30801bd 488b4c2440 mov rcx,qword ptr [rsp+40h]
00007ffa`b30801c2 e889beeeff call Foo.MyClass.b(Int32) (00007ffa`b2f6c050)
00007ffa`b30801c7 90 nop
00007ffa`b30801c8 90 nop

00007ffa`b30801c9 c644242401 mov byte ptr [rsp+24h],1
00007ffa`b30801ce ebd6 jmp One!Foo.MyClass.a()+0x36 (00007ffa`b30801a6)
00007ffa`b30801d0 90 nop
00007ffa`b30801d1 4883c438 add rsp,38h
00007ffa`b30801d5 c3 ret
00007ffa`b30801d6 0000 add byte ptr [rax],al
00007ffa`b30801d8 1909 sbb dword ptr [rcx],ecx
00007ffa`b30801da 0100 add dword ptr [rax],eax
00007ffa`b30801dc 096200 or dword ptr [rdx],esp


So we see that for b a call is made to the memory location 00007ffa`b2f6c050. We can see what is there now by disassembling that address.

0:000> u 00007ffa`b2f6c050
Foo.MyClass.b(Int32):
00007ffa`b2f6c050 e87b5e755f call clr!PrecodeFixupThunk (00007ffb`126c1ed0)
00007ffa`b2f6c055 5e pop rsi
00007ffa`b2f6c056 0201 add al,byte ptr [rcx]


So basically instead of real native JITed code existing for b() there is actually a stub or thunk in it’s place. So we clearly establish that when a function is called it’s entire code is JITed and other method it calls is not yet JITed (however, there are caveats like inline methods etc). Now we can now go and set a breakpoint inside JIT to break when it tries it JIT the b() method. This is what we do

0:000> bp clr!UnsafeJitFunction ;$$ entry point for JITing a method
0:000> g ;$$ continue executing until we hit the UnsafeJITFunction
0:000> k ;$$ dump the stack for JITing
clr!UnsafeJitFunction
clr!MethodDesc::MakeJitWorker
clr!MethodDesc::DoPrestub
clr!PreStubWorker+0x3d6
clr!ThePreStub+0x5a [f:\dd\ndp\clr\src\vm\amd64\ThePreStubAMD64.asm @ 92]
One!Foo.MyClass.a()+0x57 [d:\Skydrive\Code\C#\_JITPresentation\One.cs @ 12]


As we can see that the JITing actually happened in the same call thread that is executing a() and exactly when b was called. ThePreStub finally calls the JITer. The JITer will actually JIT the method b() and backtrack the stack and patch up the call, so that it will actually now be a call straight to the JITed copy of b(). We hit g couple of times and now see what happens for the MethodDescriptor for b()

0:000> !dumpmd 00007ffab2f640c0
Method Name: Foo.MyClass.b(Int32)
Class: 00007ffab3072340
MethodTable: 00007ffab2f640d8
mdToken: 0000000006000002
Module: 00007ffab2f62fc8
IsJitted: yes
CodeAddr: 00007ffab30801f0 <-- Now it is JITed
Transparency: Critical


As we see b() is now JITed and we can see it’s disassembly as well. However, more interesting, lets go back and see what the disassembly of a() now contains

0:000> u 00007ffab3080170 L24
One!Foo.MyClass.a() [d:\Skydrive\Code\C#\_JITPresentation\One.cs @ 8]:
00007ffa`b3080170 48894c2408 mov qword ptr [rsp+8],rcx
00007ffa`b3080175 4883ec38 sub rsp,38h
00007ffa`b3080179 c744242000000000 mov dword ptr [rsp+20h],0
00007ffa`b3080181 c644242400 mov byte ptr [rsp+24h],0
00007ffa`b3080186 48b83834f6b2fa7f0000 mov rax,7FFAB2F63438h
00007ffa`b3080190 8b00 mov eax,dword ptr [rax]
00007ffa`b3080192 85c0 test eax,eax
00007ffa`b3080194 7405 je One!Foo.MyClass.a()+0x2b (00007ffa`b308019b)
00007ffa`b3080196 e82574b25f call clr!JIT_DbgIsJustMyCode (00007ffb`12ba75c0)
00007ffa`b308019b 90 nop
00007ffa`b308019c c744242000000000 mov dword ptr [rsp+20h],0
00007ffa`b30801a4 eb23 jmp One!Foo.MyClass.a()+0x59 (00007ffa`b30801c9)
00007ffa`b30801a6 90 nop
00007ffa`b30801a7 8b4c2420 mov ecx,dword ptr [rsp+20h]
00007ffa`b30801ab ffc1 inc ecx
00007ffa`b30801ad 8b442420 mov eax,dword ptr [rsp+20h]
00007ffa`b30801b1 89442428 mov dword ptr [rsp+28h],eax
00007ffa`b30801b5 894c2420 mov dword ptr [rsp+20h],ecx
00007ffa`b30801b9 8b542428 mov edx,dword ptr [rsp+28h]
00007ffa`b30801bd 488b4c2440 mov rcx,qword ptr [rsp+40h]
00007ffa`b30801c2 e889beeeff call Foo.MyClass.b(Int32) (00007ffa`b2f6c050)
00007ffa`b30801c7 90 nop
00007ffa`b30801c8 90 nop
00007ffa`b30801c9 c644242401 mov byte ptr [rsp+24h],1
00007ffa`b30801ce ebd6 jmp One!Foo.MyClass.a()+0x36 (00007ffa`b30801a6)
00007ffa`b30801d0 90 nop
00007ffa`b30801d1 4883c438 add rsp,38h
00007ffa`b30801d5 c3 ret
00007ffa`b30801d6 0000 add byte ptr [rax],al
00007ffa`b30801d8 1909 sbb dword ptr [rcx],ecx
00007ffa`b30801da 0100 add dword ptr [rax],eax
00007ffa`b30801dc 096200 or dword ptr [rdx],esp
00007ffa`b30801df 005600 add byte ptr [rsi],dl


Now if we re-disassemble the target of this call at 00007ffa`b2f6c050

0:000> u 00007ffa`b2f6c050
Foo.MyClass.b(Int32):
00007ffa`b2f6c050 e99b411100 jmp One!Foo.MyClass.b(Int32) (00007ffa`b30801f0)
00007ffa`b2f6c055 5f pop rdi
00007ffa`b2f6c056 0201 add al,byte ptr [rcx]


As you can see the address has been patched up and now b() is JITed and a() calls into b() without going through any stubs.


Obviously in this example I took a bunch of assumptions, but hopefully you now have the understanding to go debug your own scenarios and see what is at play. Some of the takeaways if you have JIT issues at startup


JIT happens at method granularity


Use modular code. Especially if you have error handling and other code which is rarely or almost never used, instead of having them in the main function, move them out. This will ensure that they are never JITed or at best not JITed at startup

void Foo()
{
try{
//...
}
catch(Exception ex)
{
ComplexErrorHandling(ex);
}
}


is better than

void Foo()
{
try{
//...
}
catch(Exception ex)
{
LogLocal();
UploadToSomeServer();
// MoreCode;
// EvenMoreCode;
}
}


For a given function running it once, JITs the whole function. However, do note that if it has difference code branches and each calls other functions you will need to execute all branches. In the case below Foo has to be called with both true and false to ensure downstream methods are JITed

void Foo(bool flag)
{
if(flag)
YesFlag();
else
NoFlag();
}


JITing happens in the same thread as the calls. The JIT engine does takes lock to ensure there is no races while JITing the same method from multiple threads.


Consider using NGEN, MultiCoreJIT or ForceJIT all methods you care about or even build your own mechanism based on the following code


Here’s some PseudoCode to force JIT which accomplishes that using RuntimeHelpers.PrepareMethod API (note this code does no error handling whatsoever). You can craft code around this to ForceJIT only assemblies and/or types in them that is causing JIT bottlenecks. Also this can be parallelized across cores. The .NET Multicore JIT is based on similar principle but automatically does it by generating a profile of what executes at your application startup and then JITing it for you in the next go.

using System;
using System.Reflection;
namespace ConsoleApplication5
{
class Program
{
static private void ForceJit(Assembly assembly)
{
var types = assembly.GetTypes();

foreach (Type type in types)
{
var ctors = type.GetConstructors(BindingFlags.NonPublic
| BindingFlags.Public
| BindingFlags.Instance
| BindingFlags.Static);

foreach (var ctor in ctors)
{
JitMethod(assembly, ctor);
}

var methods = type.GetMethods(BindingFlags.DeclaredOnly
| BindingFlags.NonPublic
| BindingFlags.Public
| BindingFlags.Instance
| BindingFlags.Static);

foreach (var method in methods)
{
JitMethod(assembly, method);
}
}
}

static private void JitMethod(Assembly assembly, MethodBase method)
{
if (method.IsAbstract || method.ContainsGenericParameters)
{
return;
}

System.Runtime.CompilerServices.RuntimeHelpers.PrepareMethod(method.MethodHandle);
}

static void Main(string[] args)
{
ForceJit(Assembly.LoadFile(@"d:\Scratch\asm.dll"));
}
}
}

Saturday, September 28, 2013

Custom Resolution of Assembly References in .NET

Right now I am helping out a team with an assembly resolution conflict bug. I thought I’d share the details out, because I am sure others have landed in this situation.

In a complex managed applications, especially in cases where the application uses dynamically loaded plugins/addons, it’s common that all the assemblies required by these addons are not present in the assembly probing path. In the perfect world the closure set of all assembly references of an application is strong-named and the CLR binder uses standard probing order to find all assemblies and everything works perfectly. However, the world is not ideal.

Requirement of having to resolve assemblies from different locations do arise and .NET has support for that. E.g. this stackoverflow question http://stackoverflow.com/questions/1373100/how-to-add-folder-to-assembly-search-path-at-runtime-in-net has been rightly been answered by pointing to AssemblyResolve event. When .NET fails to find an assembly after probing (looking through) the various folders .NET uses for assemblies, it raises an AssemblyResolve event. User code can subscribe to this event and supply assemblies from whatever path it wants to.

This simple mechanism can be abused and results in major system issues. The main problem arises from over-eager resolution code. Consider an application A that uses two modules (say plugins) P1 and P2. P1 and P2 is somehow registered to A, and A uses Assembly.Load to load P1 and P2. However, P1 and P2 ships with various dependencies which it places in various sub-directories which A is unaware of and the CLR obviously doesn’t look into those folders to resolve the assemblies. To handle this situation both P1 and P2 has independently decided to subscribe to the AssemblyResolve event.

The problem is that for all cases CLR fails to locate an assembly it will call these resolve-event handlers sequentially. So based on the order of registering these handlers, it is possible that for a missing dependency of P2 the resolution handler of P1 gets called. Coincidentally it is possible that the assembly CLR is failing to resolve is known to both P1 and P2. Could be because the name is generic or because maybe it’s a widely used 3rd party assembly which a ton of plugins use. So P1 loads this missing assembly P2 is referring to and returns it. CLR goes ahead and binds P2 to the assembly P1 has returned. This is when bad things start to happen because maybe P2 needs a different version of it. Crash follows.

The MSDN documentation has already called out how to handle these issues in http://msdn.microsoft.com/en-us/library/ff527268.aspx. Essentially follow these simple rules

  1. Follow the best practices for assembly loading http://msdn.microsoft.com/en-us/library/dd153782.aspx
  2. Return null if you do not recognize the referring assembly
  3. Do not try to resolve assemblies you do not recognize
  4. Do not use Assembly.Load or AppDomain.Load to resolve the assemblies because that can result in recursive calls to the same ResolveEvent finally leading to stack-overflow.

The skeleton code for the resolve event handler can be something like

static Assembly currentDomain_AssemblyResolve(object sender, ResolveEventArgs args)
{
// Do not try to resolve assemblies which your module doesn't explicitly handle
// There will be other resolve handlers that are called in-sequence, let them
// do their job
if (args.RequestingAssembly == null || !IsKnownAssembly(args.RequestingAssembly))
return null;

// parse and create name of the assembly being requested and then use your own logic
// to locate the assembly
AssemblyName aname = new AssemblyName (args.Name);
string path = FindAssemblyByCustomLogic(aname);

if (!File.Exists(path))
return null;

Assembly assembly = Assembly.LoadFile(path);
return assembly;
}


Here you need to fill in the implementation of IsKnownAssembly which only returns true for assemblies that belong to your module.

Tuesday, April 02, 2013

C++/CLI and mixed mode programming

beach

I had very limited idea about how mixed mode programming on .NET works. In mixed mode the binary can have both native and managed code. They are generally programmed in a special variant of the C++ language called C++/CLI and the sources needs to be compiled with /CLR switch.

For some recent work I am doing I had to ramp up on Managed C++ usage and how the .NET runtime supports the mixed mode assemblies generated by it. I wrote up some notes for myself and later thought that it might be helpful for others trying to understand the inner workings.

History

The initial foray of C++ into the managed world was via the managed extension for C++ or MC++. This is deprecated now and was originally released on VS 2003.  This MC++ syntax turned out to be too confusing and wasn’t adopted well. The MC++ was soon replaced with C++/CLI. C++/CLI added limited extension over C++ and was more well designed so that the language feels more in sync with the general C++ language specification.

C++/CLI

The code looks like below.

ref class CFoo
{
public:
CFoo()
{
pI = new int;
*pI = 42;
str = L"Hello";
}

void ShowFoo()
{
printf("%d\n", *pI);
Console::WriteLine(str);
}

int *pI;
String^ str;
};

In this code we are defining a reference type class CFoo. This class uses both managed (str) and native (pI) data types and seamlessly calls into managed and native code. There is no special code required to be written by the developer for the interop.


The managed type uses special handles denoted by ^ as in String^ and native pointers continue to use * as in int*. A nice comparison between C++/CLI and C# syntax is available at the end of http://msdn.microsoft.com/en-US/library/ms379617(v=VS.80).aspx. Junfeng also has a good post at http://blogs.msdn.com/b/junfeng/archive/2006/05/20/599434.aspx


The benefits of using mixed mode


  1. Easy to port over C++ code and take the benefit of integrating with other managed code
  2. Access to the extensive managed API surface area
  3. Seamless managed to native and native to managed calls
  4. Static-type checking is available (so no mismatched P/Invoke signatures)
  5. Performance of native code where required
  6. Predictable finalization of native code (e.g. stack based deterministic cleanup)


Implicit Managed and Native Interop


Seamless, static type-checked, implicit, interop between managed and native code is the biggest draw to C++/CLI.


Calls from managed to native and vice versa are transparently handled and can be intermixed. E.g. managed --> unmanaged --> managed calls are transparently handled without the developer having to do anything special. This technology is called IJW (it just works). We will use the following code to understand the flow.

#pragma managed
void ManagedAgain(int n)
{
Console::WriteLine(L"Managed again {0}", n);
}

#pragma unmanaged
void NativePrint(int n)
{
wprintf(L"Native Hello World %u\n\n", n);
ManagedAgain(n);
}

#pragma managed

void ManagedPrint(int n)
{
Console::WriteLine(L"Managed {0}", n);
NativePrint(n);
}

The call flow goes from ManagedPrint --> NativePrint –> ManagedAgain


Native to Managed


For every managed method a managed and an unmanaged entry point is created by the C++ compiler. The unmanaged entry point is a thunk/call-forwarder, it sets up the right managed context and calls into the managed entry point. It is called the IJW thunk.


When a native function calls into a managed function the compiler actually binds the call to the native forwarding entry point for the managed function. If we inspect the disassembly of the NativePrint we see the following code is generated to call into the ManagedAgain function

00D41084  mov         ecx,dword ptr [n]         // Store NativePrint argument n to ECX
00D41087 push ecx // Push n onto stack
00D41088 call ManagedAgain (0D4105Dh) // Call IJW Thunk


Now at 0x0D4105D is the address for the native entry point. If forwards the call to the actual managed implementation

ManagedAgain:
00D4105D jmp dword ptr [__mep@?ManagedAgain@@$$FYAXH@Z (0D4D000h)]

Managed to Native


In the case where a managed function calls into a native function standard P/Invoke is used. The compiler just defines a P/Invoke signature for the native function in MSIL

.method assembly static pinvokeimpl(/* No map */) 
void modopt([mscorlib]System.Runtime.CompilerServices.CallConvCdecl)
NativePrint(int32 A_0) native unmanaged preservesig
{
.custom instance void [mscorlib]System.Security.SuppressUnmanagedCodeSecurityAttribute::.ctor() = ( 01 00 00 00 )
// Embedded native code
// Disassembly of native methods is not supported.
// Managed TargetRVA = 0x00001070
} // end of method 'Global Functions'::NativePrint


The managed to native call in IL looks as

Manged IL:
IL_0010: ldarg.0
IL_0011: call void modopt([mscorlib]System.Runtime.CompilerServices.CallConvCdecl) NativePrint(int32)

The virtual machine (CLR) at runtime generates the correct thunk to get the managed code to P/Invoke into native code. It also takes care of other things like marshaling the managed argument to native and vice-versa.


Managed to Managed


While it would seem this should be easy, it was a bit more convoluted. Essentially the compiler always bound to native entry point for a given managed method. So a managed to managed call degenerated to managed -> native -> managed and hence resulted in suboptimal double P/Invoke. See http://msdn.microsoft.com/en-us/library/ms235292(v=VS.80).aspx


This was fixed in later versions by using dynamic checks and ensuring managed calls always call into managed targets directly. However, in some cases managed to managed calls still degenerate to double P/Invoke. So an additional knob provided was the __clrcall calling convention keyword. This will stop the native entry point from being generated completely. The pitfall is that these methods are not callable from native code. So if I stick in a __clrcall infront of ManagedAgain I get the following build error while compiling NativePrint.

Error	2	error C3642: 'void ManagedAgain(int)' : cannot call a function with
__clrcall calling convention from native code <filename>

/CLR:PURE


If a C++ file is compiled with this flag, instead of mixed mode assembly (one that has both native and MSIL) a pure MSIL assembly is generated. So all methods are __clrcall and the Cpp code is compiled into MSIL code and NOT to native code.


This comes with some benefits as in the assembly becomes a standard MSIL based assembly which is no different from another managed only assembly. Also it comes with some limitation. Native code cannot call into the managed codes in this assembly because there is no native entry point to call into. However, native data is supported and also the managed code can transparently call into other native code. Let's see a sample


I moved all the unmanaged code to a separate /C++:CLI dll as

void NativePrint(int n)
{
wprintf(L"Native Hello World %u\n\n", n);
}

Then I moved my managed C++ code to a new project and compiled it with /C++:PURE

#include "stdafx.h"
#include

#include "..\Unmanaged\Unmanaged.h"
using namespace System;

void ManagedPrint(int n)
{
char str[30] = "some cool number"; // native data
str[5] = 'f'; // modifying native data
Console::WriteLine(L"Managed {0}", n); // call to BCL
NativePrint(n); // call to my own native methods
printf("%s %d\n\n", str, n); // CRT
}

int main(array ^args)
{
ManagedPrint(42);
return 0;
}

The above builds and works fine. So even with C/++:PURE I was able to


  1. Use native data like a char array and modify it
  2. Call into BCL (Console::WriteLine)
  3. Call transparently into other native code without having to hand generate P/Invoke signatures
  4. Use native CRT (printf)

However, no native code can call into ManagedPrint. Also do note that even though Pure MSIL is generated, the code is unverifiable (think C# unsafe). So it doesn't get the added safety that the managed runtime provides (e.g. I can just do str[200]  = 0 and not get any bounds check error)


/CLR:Safe


/CLR:safe compiler switch generates MSIL only assemblies whose IL is fully verifiable. The output is not different from anything generated from say C# or VB.NET compilers. This provides more security to the code but at the same time losses on several capabilities over and above the PURE variant


  1. No support for CRT


  1. Only explicit P/Invokes

So for /CLR:Safe we need to do the following

[DllImport("Unmanaged.dll")]
void NativePrint(int i);

void ManagedPrint(int n)
{
//char str[3000] = "some cool number"; // will fail to compile with
//str[5] = 'f'; // "this type is not verifiable"

Console::WriteLine(L"Managed {0}", n);

NativePrint(n); // Hand coded P/Invoke

Migration


MSDN has some nice articles on people trying to migrate from /CLR to


  1. To /CLR:Pure http://msdn.microsoft.com/en-US/library/ms173253(v=vs.80).aspx


  1. To /CLR:Safe http://msdn.microsoft.com/en-US/library/ykbbt679(v=vs.80).aspx

Moving to Outlook from Google Reader

I am sure everyone by now knows that Google Reader is being shutdown. I am a heavy user of Google Reader or Greeder as I call it and I immediately started looking for an alternative, when this suddenly occurred to me, that all PC’s I use have Outlook installed on them. So if you work for an organization that runs on Exchange server, this could really work out well. You can use Office Outlook and Exchange as a great RSS feed reader. Consider this

  1. It will provide full sync across multiple Outlook clients running on different PCs
  2. It will provide on the go access via Outlook Web-access
  3. Your phone’s outlook client should also work with it
  4. You can pretend to work while wasting time on boingboing

First things first: Export the opml file from Google Reader

Login to www.google.com and then go to https://www.google.com/takeout/#custom:reader

image

This will take some time and create an archive.

image

Click on the download button and save the zip. Then extract the zip as follows

image

Inside the extracted folder you will have the opml file. For me it’s in C:\Users\admin\Desktop\XXXXXXXX@gmail.com-takeout\XXXXXXXX@gmail.com-takeout\Reader\subscriptions.xml

Import to Outlook

This opml file needs to be imported into outlook. Use the File tab and bring up the following UI in Outlook.

image

Then use Import. To bring up the following

image

Choose OPML file and tap on Next. Now point it to the file you extracted. For me it was C:\Users\admin\Desktop\XXXXXXXX@gmail.com-takeout\XXXXXXXX@gmail.com-takeout\Reader\subscriptions.xml

Hit next and finally choose the feeds you want to import (Select All).

image

The tap on Next and here you have Outlook as an Rss feed reader…

image

Read Everywhere

It totally sync’s on the cloud. Here I have it open on the browser. As you read a post it tracks what you are reading and across the browsers and all your outlook clients at work and home it will update and keep everything in sync.

image

Works great on the Windows Phone as well. I assume any Exchange client should work.

wp_ss_20130314_0002wp_ss_20130314_0001

Pain Points

While reading on Outlook was seamless, there are some usability issues in both the browser and the phone. Surface RT is broken. Someone should really fix the mail client on Surface Sad smile

The major paint point I see is that in the Outlook Web Access the pictures are not shown. Tapping on the picture placeholders work. I think some security feature is blocking the embedded images.

Also on the Windows Phone you have to go to each feed and set it up so that it syncs that folder. This is a pain but I guess this is to protect against download over the carrier networks.

Tuesday, October 16, 2012

Test Driven Development of a Generational Garbage Collection

Crater Lake, OR panorama

These days everyone is talking about being agile and test driven development (TDD). I wanted to share a success story of TDD that we employed for developing Generational Garbage Collector (GC) for Windows Phone Mango.

The .NET runtime on Windows Phone 7 shipped with a mark-sweep-compact; stop the world global non-generational GC. Once a GC was triggered, it stopped all managed execution and scanned the entire managed heap to look up all managed references and cleaned up objects that were not in use. Due to performance bottleneck we decided to enhance the GC by adding a generational GC (referred to as GenGC). However, post the General Availability or GA of WP7 we had a very short coding window. Replacing such a fundamental piece of the runtime in that short window was very risky. So we decided to build various kinds of stress infrastructure first, and then develop the GC. So essentially

  1. Write the tests
  2. See those tests failing
  3. Write code for the generational GC
  4. Get tests to pass
  5. Use the tests for regression tracking as we refactor the code and make it run faster

Now building tests for a GC is not equivalent of traditional testing of features or APIs where you write tests to call into mocked up API, see it fail until you add the right functionality. Rather these tests where verifications modes and combination of runtime stresses that we wrote.

To appreciate the testing steps we took do read the Back To Basics: Generational Garbage Collection and WP7 Mango: Mark-Sweep collection and how does a Generational GC help posts

Essentially in a generational GC run all of the following references should be discovered by the GC

  1. Gen0 Objects reachable via roots (root –> object OR recursively root –> object –> object )
  2. Objects accessible from runtime native code (e.g. pinned for PInvoke, COM interop, internal runtime references)
  3. Objects referenced via Gen1 –> Gen0 pointers

The first two were anyway heavily covered by our traditional GC tests. #3 being the new area being added.

To implement a correct generational GC we needed to ensure that at all places in the runtime where managed object references are updated they need to get reflected in the CardTable (#3 above). This is a daunting task and prone to bugs via omission as we need to ensure that

  1. All forms of assignments in MSIL that we JIT there are calls to update the CardTable.
  2. All places in the native runtime code where such references are directly and or indirectly updated the same thing is ensured. This includes all JIT worker-routines, COM, Marshallers.

If a single instance is missed then it would result in valid/reachable Gen0 objects being collected (or deleted) and hence in the longer run result in memory corruption, crashes that will be hard if not impossible to debug. This was assessed to be the biggest risk to shipping generational GC.

The other problem is that these potential omissions can be only exposed by certain ordering of allocation and collection. E.g. only a missing tracked reference of A –> B can result in a GC issue only if a GC happened in between allocations of A and B (A is in higher generation than B). Also due to performance reasons (write atomicity for lock-less updates) for every assignment of A = B we do not update the card-table bit that covers the memory area of A. Rather we update the whole byte in the card-table. This means an update to A will cover other objects allocated adjacent to A. Hence if an update to an object just beside A in the memory is missed it will not be discovered until some other run where that object lands up being allocated farther away from A.

GC Verification mode

Our solution to all of these problems was to first create the GC verification mode. What this mode does is runs the traditional full mark-sweep GC. While running that GC it goes through all objects in the memory and as it traverses them for every reference A (Gen1) –> B(Gen0), it verifies that the card table bit for A is indeed set. This ensures that if a GenGC was to run, it would not miss that references

Granular CardTable

We used very high granular card-table resolution for test runs. For these special runs each bit of the card-table corresponded to almost one object (1 bit to 2 byte resolution). Even though the card-table size exploded it was fine because this wasn’t a shipping configuration. This spaced out objects covered by the card-table and exposed adjacent objects not being updated.

GC Stress

In addition we ran the GC stress mode, where we made the GC run extremely frequently (we could push it up to a GC in every allocation). The allocator was also updated to ensure that allocations were randomized so that objects moved around everywhere in the memory.

Hole Finder

Hole finder moves all objects around in memory after a GC. This exposes stale pointer issues. If an object didn’t get updated properly due to the GC it would now point to invalid memory because all previous memory locations are now invalid memory. So a subsequent write will fail-fast with AV and we can easily detect that point of failure.

With all of these changes we ran the entire test suites. Also by throttling down the GC Stress mode we could still use the runtime to run real apps on the phone. Let me tell you playing NFS on a device with the verification mode, wasn’t fun :)

With this precaution we ensured that not a single GenGC bug has come in from the phone. It shipped rock solid and we were more confident with code churn because regressions would always be caught. I actually never blogged about this because I felt that if I do, it’ll jinx something :)

Core Parking

Rainier

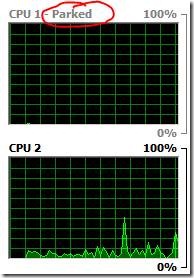
For some time now, my main box got a bit slow and was glitching all the time. After some investigation I found that some power profile imposed by our I T department enabled CPU parking on my machine. This effectively parks CPU on low load condition to save power. However,

  1. This effects high load conditions as well. There is a perceptible delay between the load hitting the computer and the CPU’s being unparked. Also some CPU’s remain parked for spike loads (large but smaller duration usage spikes)
  2. This is a desktop and not a laptop and hence I really do not care about power consumption that much

Windows Task Manager (Ctrl + Shift + Esc and then Performance tab) clearly shows this parking feature. 3 parked cores show flatlines

clip_image002

You can also find out if your machine is behaving the same from Task Manager -> Performance Tab -> Resource Monitor -> CPU Tab. The CPU graphs on the right will show which cores if any are parked.

clip_image004

To disable this you need to

  1. Find all occurrences of 0cc5b647-c1df-4637-891a-dec35c318583 in the Windows registry (there will be multiple of those)
  2. For all these occurrences set the ValueMin and ValueMax keys to 0
  3. Reboot

For detailed steps see the video http://www.youtube.com/watch?feature=player_detailpage&v=mL-w3X0PQnk#t=85s

Everything is back to normal once this is taken care off Smile

clip_image006

Managing your Bugs

Rainier

I have worked on bunch of large scale software product development that spanned multiple teams, thousands of engineers, many iterations. Some of those products plug into even larger products. So obviously we deal with a lot of bugs. Bugs filed on us, bugs we file on other partner teams, integration bugs, critical bugs, good to have fixes and plan ol crazy bugs. However, I have noticed one approach to handling those bugs which kind of bugs me.

Some people just cannot make hard calls on the gray area bugs and keeps hanging them around. They bump the priority down and take those bugs from iteration to iteration. These bugs always hang around as Priority 2 or 3 (in a scale of Priority 0 through 3).

I personally believe that bugs should be dealt with the same way emails should be dealt with. I always follow the 4 Ds for real bugs.

Do it

If the bug meets the fix bar and is critical enough, just go fix it. This is the high priority critical bug which rarely gives rise to any confusion. Something like the “GC crashes on GC_Sweep for application X”

Delete it (or rather resolve it)

If you feel a bug shouldn’t be fixed then simply resolve the bug. Give it back to the person who created the bug with clear reasons why you feel this shouldn’t be fixed. I know it’s hard to say “won’t fix”, but the problem is if one was to fix every bug in the system then the product will never ship. So just don’t defer the thought of making this hard call. There is no benefit in just keeping the bug hanging around for 6 months only to make the same call 2 weeks prior to shipping, citing time constraint as a reason. Make the hard call upfront. You can always tag the bug appropriately so that for later releases you can relook.

Defer it

Once you have made a call to fix the bug it should be correctly prioritized. With all bugs you know you won’t be fixing out of the way, its easy to make the right call of fixing it in the current development cycle or move it to the next iteration.

Delegate it

If you feel someone else needs to take a look at the bug because it’s not your area of expertise, QA needs to give better repro steps, someone else needs to make a call on it (see #1 and #2 above) then just assign it to them. No shame in accepting that you aren’t the best person to make a call.

WP7: CLR Managed Object overhead

Winter day

A reader contacted me over this blog to inquire about the overhead of managed objects on the Windows Phone. which means that when you use an object of size X the runtime actually uses (X + dx) where dx is the overhead of CLR’s book keeping. dx is generally fixed and hence if x is small and there are a lot of those objects it starts showing up as significant %.

There seems to be a great deal of information about the desktop CLR in this area. I hope this post will fill the gap for NETCF (the CLR for the Windows Phone 7)

All the details below are implementation detail and is provided just as guidance. Since these are not mandated by any specification (e.g. ECMA) they may and most probably will change.

General layout

The overhead varies on the type of objects. However, in general the object layout looks something like

imageSo internally just before the actual object there is a small object-header. If the object is a finalizable object (object with a finalizer) then there’s another 4-byte pointer at the end of the object. 
The exact size of the header and what's inside that header depends on the type of the object.

Small objects (size < 16KB)

All objects smaller than 16KB has a 8 byte object header.image

The 32-bits in the flag are used to store the following information

  1. Locking
  2. GC information. E.g.
    1. Bits to mark objects
    2. Generation of the object
    3. Whether the object is pinned
  3. Hashcode (for GetHashCode support)
  4. Size of the object

Since all objects are 4 byte aligned, the size is stored as an unit of 4 bytes and uses 11 bits. Which means that the maximum size that can be stored in that header is 16KB.

The second flag contains a 32-bit pointer to the Class-Descriptor or the type information of that object. This field is overloaded and is also used by the GC during compaction phase.

Since the header cost is fixed, the smaller the object the larger the overhead becomes in terms of % overhead.

Large Objects

As we saw in the previous section that the standard object header supports describing 16KB objects. However, we do need to support larger objects in the runtime.

This is done using a special large-object header which is 20 bytes.image

The overhead of large object comes to be at max of around 0.1%. A dedicated 32-bit size field allows the runtime to support very large objects (close to 2GB).

It’s weird to see that the normal object header is repeated twice. The reason is that very large objects are rare on the phone. Hence the runtime tries to optimize it’s various operations so that the large object doesn’t bring in additional code paths and checks. Given an object reference having the normal header just before it helps us in speeding various operations. At the same time having the header as the first data-structure of all objects helps us to be faster in other cases. Bottom line is that the additional 8 bytes or 0.04% extra space usage helps us in enough performance gains at other places so that we pay that extra overhead cost.

Pool overhead

NETCF uses 64KB object pools and then sub-allocates objects from it. So in addition to the per-object overhead it uses an additional 44-byte of object-pool-header per 64kb. This means another 0.06% overhead per 64KB. For every object, the contribution of this can be ignored.

Arrays

Arrays pan out slightly differently.

image

In case of value type array every member doesn’t really need to have the type information and hence the object header associated with it. The Array header is a standard object header of 8 bytes or big object header of 20bytes (based on the size of the array). Then there is a 32-bit count of the number of elements in the array. For single dimension array there is no more overhead. However, for higher dimension arrays the length in each dimension is also stored to support runtime bounds check.

The reference type arrays are similar but instead of the array contents being inlined into the array the elements are references to the objects on the managed heap and each of those objects have their standard headers.

Putting it all together

Standard object 8 bytes ( + 4 bytes for finalizable object)
Large objects (>16KB) 20 bytes ( + 4 bytes for finalizable object)
Arrays object overhead + 4 bytes array header + (nDimension x 4 bytes)

My first Windows Phone App

lighthouse

imageI have been involved with Windows Phone 7 from the very beginning and worked on delivering the CLR for the GA version and all the way through Nodo and Mango.

All this while I was busy working on one of the lower layers and seeing bits and bytes flying by. For some time I wanted to try out writing an app for the phone to experience how it feels to be our developer customer. Unfortunately my skills fall more on system programming than designing good looking UI. I had a gazillion ideas floating in my head but most were beyond my graphic and UI design skills. I was also waiting for some sort of inspiration.

Over the last school break our local King Country Library System which earned the best library system of the year award run an interesting effort. Students received a sheet which they filled up as they read books. On hitting 500 minutes and 1000 minutes of book reading they got prizes. One of the prize was a Kaleidoscope. Not the one with colored glass pieces like I had as a child, but one through which you could see everything around. This was the inspiration I was waiting for and I wrote an WP7 Mango app that does the same. Interestingly the app got a lot of good reviews and is rated at 5 stars (something I didn’t expect). It’s free, go check it out.

Get the app here, documentation is at http://bonggeek.com/Kaleidoscope/

Wednesday, June 08, 2011

WP7 Mango: Mark-Sweep collection and how does a Generational GC help

About a month back we announced that in the next release of Windows Phone 7 (codenamed Mango) we will ship a new garbage collector in the CLR. This garbage collector (GC) is a generational garbage collector.

This post is a “back to basics” post where I’ll try to examine how a mark-sweep GC works and how adding generational collection helps in boosting it’s performance. We will take a simplified look at how mark-sweep-compact GC works and how generational GC can enhance it’s performance. In later posts I’ll try to elaborate on the specifics of the WP7 generational GC and how to ensure you get the best performance out of it.

Object Reference Graph

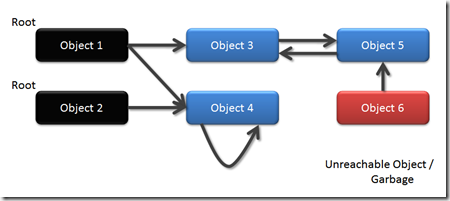
Objects in the memory can be considered to be a graph. Where every object is a node and the references from one object to another are edges. Something like

image

To use an object the code should be able to “reach” it via some reference. These are called reachable objects (in blue). Objects like a method’s local variable, method parameters, global variables, objects held onto by the runtime (e.g. GCHandles), etc. are directly reachable. They are the starting points of reference chains and are called the roots (in black).

Other objects are reachable if there are some references to them from roots or from other objects that can be reached from the roots. So Object4 is reachable due to the Object2->Object4 reference. Object5 is reachable because of Object1->Object3->Object5 reference chain. All reachable objects are valid objects and needs to be retained in the system.

On the other hand Object6 is not reachable and is hence garbage, something that the GC should remove from the system.

Mark-Sweep-Compact GC

A garbage collector can locate garbage like Object6 in various ways. Some common ways are reference-counting, copying-collection and Mark-Sweep. In this section lets take a more pictorial view of how mark-sweep works.

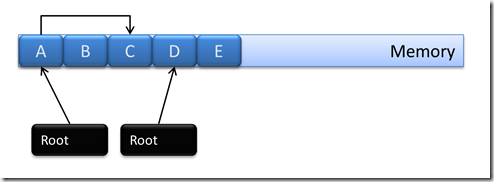
Consider the following object graph

1

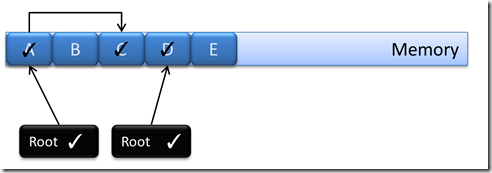
At first the GC pauses the entire application so that the object graph is not being mutated (as in no new objects or references are being created). Then it goes into the mark phase. In mark phase the GC traverses the graph starting at the roots and following the references from object to object. Each time it reaches an object through a reference it flips a bit in the object header indicating that this object is marked or in other words reachable (and hence not garbage). At the end everything looks as follows

2

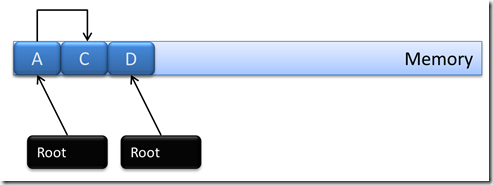
So the 2 roots and the objects A, C, D are reachable.

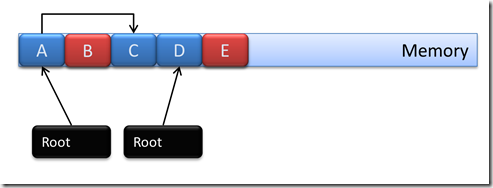
Next it goes into the sweep phase. In this phase it starts from the very first object and examines the header. If the header’s mark bit is set it means that it’s a reachable object and the sweep resets that bit. If the header’s bit is not set, it’s not reachable and is flagged as garbage.

3

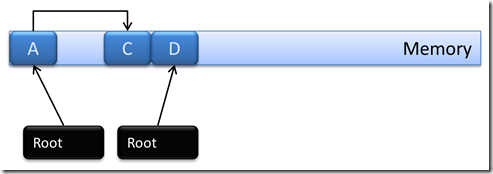
So B and E gets flagged as garbage. Hence these areas are free to be used for other objects or can be released back to the system

4

This is where the GC is done and it may resume the execution of the application. However, if there are too many of those holes (released objects) created in the system, then the memory gets fragmented. To reduce memory fragmentation. The GC may compact the memory by moving objects around. Do note that compaction doesn’t happen for every GC, it is run based on some fragmentation heuristics.

5

Both C and D is moved here to squeeze out the hole for B. At the same time all references to these objects in the system is also update to point to the correct location.

One important thing to note here is that unlike native objects, managed objects can move around in memory due to compaction and hence taking direct references to it (a.k.a memory pointers) is not possible. In case this is ever required, e.g. a managed buffer is passed to say the microphone driver native code to copy recorded audio into, the GC has to be notified that the corresponding managed object cannot be moved during compaction. If the GC runs a compaction and object moves during that microphone PCM data copy, then memory corruption will happen because the object being copied into would’ve moved. To stop that, GCHandle has to be created to that object with GCHandleType.Pinned to notify the GC that the corresponding object should never move.

On the WP7 the interfaces to these peripherals and sensors are wrapped by managed interfaces and hence the WP7 developer doesn’t really have to do these things, they are taken care offm under the hood by those managed interfaces.

The performance issue

As mentioned before during the entire GC the execution of the application is stopped. So as long as the GC is running the application is frozen. This isn’t a problem in general because the GC runs pretty fast and infrequently. So small latencies of the order of 10-20ms is not really noticeable.

However, with WP7 the capability of the device in terms of CPU and memory drastically increased. Games and large Silverlight applications started coming up which used close to 100mb of memory. As memory increases the number of references those many objects can have also increases exponentially. In the scheme explained above the GC has to traverse each and every object and their reference to mark them and later remove them via sweep. So the GC time also increases drastically and becomes a function of the net workingset of the application. This results in very large pauses in case of large XNA games and SL applications which finally manifests as long startup times (as GC runs during startup) or glitches during the game play/animation.

Generational Approach

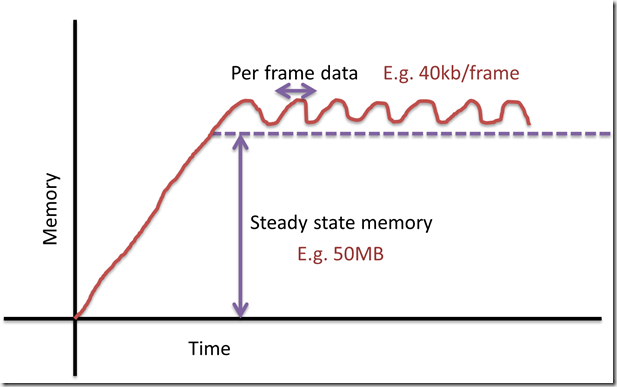
If we take a look at a simplified allocation pattern of a typical game (actually other apps are also similar), it looks somewhat like below

image

The game has a large steady state memory which contains much of it’s steady state data (which are not released) and then per-frame it goes on allocating/de-allocating some more data, e.g. for physics, projectiles, frame-data. To collect this memory layout the traditional GC has to walk or traverse the entire 50+ mb of data to locate the garbage in it. However, most of the data it traverses will almost never be garbage and will remain in use.

This application behavior is used for the Generational GC premise

  1. Most objects die young
  2. If an object survives collection (that is doesn’t die young) it will survive for a very long time

Using these premise the generational GC tries to segregate the managed heap into older and younger generations objects. The younger generation called Gen-0 is collected in each GC (premise 1), this is called the Ephemeral or Gen0 Collection. The older generation is called Gen-1. The GC rarely collects the Gen-1 as the probability of finding garbage in it is low (premise 2).

image

So essentially the GC becomes free of the burden of the net working set of the application.

Most GC will be ephemeral GC and it will only traverse the recently allocated objects, hence the GC latency remains very low. Post collection the surviving objects are promoted to the higher generation. Once a lot of objects are promoted, the higher generation starts becoming full and then a full collection is run (which collects both gen-1 and gen-0). However, due to premise 1, the ephemeral collection finds a lot of garbage in their runs and hence promotes very few objects. This means the growth rate of the higher generation is low and hence full-collection will run very infrequently.

Ephemeral/Gen-0 collection

Even in ephemeral collection the GC needs to deterministically find all objects in Gen-0 which are not reachable. This means the following objects needs to survive a Gen-0 collection

  1. Objects directly reachable from roots
  2. Root –> Gen0 –> Gen-0 objects (indirectly reachable from roots)
  3. Objects referenced from Gen1 to Gen0

Now #1 and #2 pose no issues as in the Ephemeral GC, we will anyway scan all roots and Gen-0 objects. However to find objects from Gen1 which are referencing objects in Gen-0, we would have to traverse and look into all Gen1 objects. This will break the very purpose of having segregating the memory into generation. To handle this write-barrier+card-table technique is used.

The runtime maintains a special table called card-table. Each time any references are taken in the managed code e.g. a.b = c; the code JITed for this assignment also updates an internal data-structure called CardTable to capture that write. Later during the ephemeral collection, the GC looks into that table to find all the ‘a’ which took new references. If that ‘a’ is a gen-1 object and ‘c’ a gen-0 object then it marks ‘c’ recursively (which means all objects reachable from ‘c’ is also marked). This technique ensures that without examining all the gen-1 objects we can still find all live objects in Gen-0. However, the cost paid is

  1. Updating object reference is a little bit more costly now
  2. Making old object taking references to new objects increases GC latency (more about these in later posts)

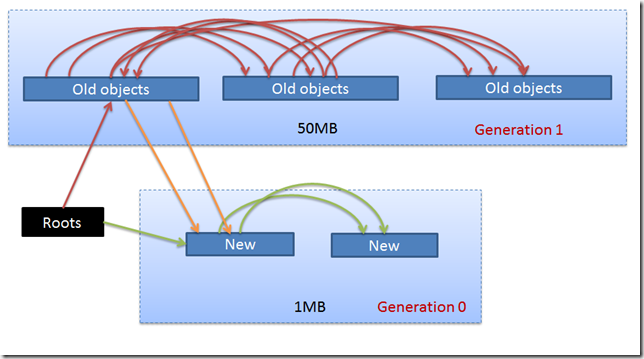
Putting it all together, the traditional GC would traverse all references shown in the diagram below. However, an ephemeral GC can work without traversing the huge number of Red references.

image

It scans all the Roots to Gen-0 references (green) directly. It traverses all the Gen1->Gen0 references (orange) via the CardTable data structure.

Conclusion

  1. Generational GC reduces the GC latency by avoiding looking up all objects in the system
  2. Most collections are gen-0 or ephemeral collection and are of low latency this ensures fast startup and low latency in game play
  3. However, based on how many objects are being promoted full GC’s are run sometimes. When they do, they exhibit the same latency as a full GC on the previous WP7 GC

Given the above most applications will see startup and in-execution perf boost without any modification. E.g today if an application allocates 5 MB of data during startup and GC runs after every MB of allocation then it traverses 15mb (1 + 2 + 3 + 4 + 5). However, with GenGC it might get away with traversing as low as only 5mb.

In addition, especially game developers can optimize their in-gameplay allocations such that during the entire game play there is no full collection and hence only low-latency ephemeral collections happens.

How well the generational scheme works depend on a lot of parameters and has some nuances. In the subsequent posts I will dive into the details of our implementation and some of the design choices we made and what the developers needs to do to get the most value out of it.