- Close on broad design before sending PRs.
- Add design as markdown to root of the feature code path and discuss it as a PR. For broad cross RP feature it is ok to place it in the root
- For sizable features please have a design meeting
- Requirement for a design meeting is to send a pre-read and expectation is all attendees have reviewed the pre-read before coming in
- Be aware of distributed system quirks
- Think CAP theorem. This is a distributed system, network partition will occur, be explicit about your availability and consistency model in that event
- All remote calls will fail, have re-tries that uses exponential back-off. Log warning on re-tries and error if it finally fails
- Ensure we always have consistent state. There should be only 1 authoritative version of truth. Having local data that is eventually consistent with this truth is acceptable. Know the max time-period for eventual consistency
- System needs to be reliable, scalable and fault tolerant
- Always avoid SPOF (Single Point of Failure), even for absolutely required resources like SQLServer consider retrying (see below), gracefully fail and recover
- Have retries
- APIs need to be responsive and return in sub second for most scenarios. If something needs to take longer, immediately return with a mechanism to track progress on the background job started
- All API and actions we support should have a 99.9 uptime/success SLA. Shoot for 99.95
- Our system should be stateless (have state elsewhere in data-store) and designed to be cattle and not pets
- Systems should be horizontally scalable. We should be able to simply add more nodes to a cluster to handle more traffic
- Choose to use a managed service over attempting to build it or deploy it in-house
- Treat configuration as code
- Breaks due to out of band config changes are too common. So consider config deployment the same way as code deployment (Use SCD == Safe Config/Code Deployment)
- Config should be centralized. Engineers shouldn't be hunting around to look for configs
- All features must have feature flag in config.
- The feature flag can be used to disable features in per region basis
- Once a feature flag is disabled the feature should cause no impact to the system
- Try to make sure your system works on a single boxThis makes dev-test significantly easier. Mocking auxiliary systems is OK
- Never delete things immediately
- Don't delete anything instantaneously, especially data. Tombstone deleted data away from user view
- Keep data, metadata, machines around for a garbage collector to periodically delete at configurable duration.
- Strive to be event driven
- Polling is bad as the primary mechanism
- Start with event driven approach and have fallback polling
- Have good unit tests.
- All functionality needs to ship with tests in the same PR (no test PR later)
- Unit test tests functionality of units (e.g. class/modules)
- They do not have to test every internal functions. Do not write tests for tests' sake. If test covers all scenarios exposed by an unit, it is OK to push back on comments like "test all methods".
- Think what does your unit implement and can the test validate the unit is working after any changes to it
- Similarly if you add a reference to an unit from outside and depend on a behavior consider adding a test to the callee so that changes to that unit doesn’t break your requirements
- Unit test should never call out from dev box, they should be local tests only
- Unit test should not require other things to be spun up (e.g. local SQL server)
- Consider adding BVT to scenarios that cannot be tested in unit tests.
E.g. stored procs need to run against real SqlDB deployed in a container during BVT, or test query routing that needs to run inside a web-server - All required tests should be automatically run and not require humans to remember to run them
- Test in production via our INT/canary clusterSomethings simply cannot be tested on dev setup as they rely on real services to be up. For these consider testing in production over our INT infra.
- All merges are automatically deployed to our INT cluster
- Add runners to INT that simulate customer workloads.
- Add real lab devices or fake devices that test as much as possible. E.g. add fake snmp trap generator to test fluentd pipeline, have real blades that can be rebooted using our APIs periodically
- Bits are then deployed to Canary clusters where there are real devices being used for internal testing, certification. Bake bits in Canary!
- All features should have measurable KPIs and metrics.
- You must add metrics against new features. Metrics should tell how well your feature is working, if your feature stops working or if any anomaly is observed
- Do not skimp on metrics, we can filter metrics on the backend rather than not having them fired
- Copious logging is required.
- Process should never fail silently
- You must add logs for both success and failure paths. Err on the side of too much logging
- Do not rely on text logs to catch production issues.
- You cannot rely on too many error logs from a container to catch issues. Have metrics instead (see above)
- Logs are a way to root-cause and debug and not catch issues
- Consider on-call for all development
- Ensure you have metrics and logs
- Ensure you write good documentation that anyone in the team can understand without tons of context
- Add alerts with direct link to TSGs
- Add actionable alerts where the on-call can quickly mitigate
- On-call should be able to turn off specific features in case it is causing problems in production
- All individual merges can be rolled back. Since you cannot control when code snap for production happens the PRs should be such that it can be individually rolled back
Search
Monday, February 17, 2020
System Engineering Guidelines
Tuesday, October 09, 2018
SAP HANA Large Instances on Azure
Over the past year I have been working to light up bare-metal machines on Azure Cloud. These are specialized bare-metal machines that have extremely high amount of RAM and CPU and in this particular case, purpose built to run SAP HANA in-memory database. We call them the HANA Large Instance and they come certified by SAP (see list here).
So why bare-metal? They are huge high performance machines that goes all the way up to 24TB RAM (yup) and 960 CPU threads. They are purpose built for HANA in memory database and have the right CPU/Memory ratio and high performance storage to run demanding OLTP + OLAP workloads. Imagine a bank being able to load every credit card transaction in the past 5 year and be able to do analytics including fraud detection on a new transaction in a few seconds, or track the flow of commodities from the worlds largest warehouses to millions of stores and 100s of millions of customers. These machines come with 99.99% SLA and can be reserved by customers across the world in US-East, US-West, Japan-East, Japan-West, Europe-West, Europe-North, Australia-SouthEast, Australia-East to SAP HANA workloads.
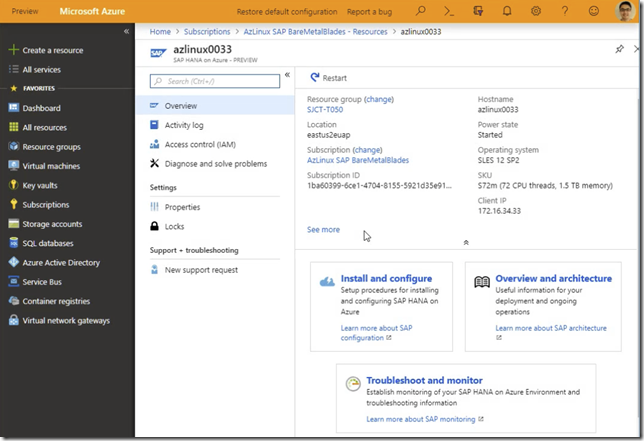
In SAP TechEd and SAPPHIRE I demoed bare-metal HLI machines with standard Azure Portal integration. Right now customers can see their HLI machines in the portal and coming soon even reboot them from the portal.
Portal preview
Click on the screenshot below to see a recorded video on how the Hana Large Instances are visible on the Azure portal and also how customers can raise support requests from the portal.
Reboot Demo
This is something we are working on right now and will be available soon. Click on the screenshot below to see the video of a HANA Large instance being rebooted from the portal directly.
Getting Access
Customers with HLI blades can run the following CLI command to register our HANA Resource Provider
az provider register --namespace Microsoft.HanaOnAzure
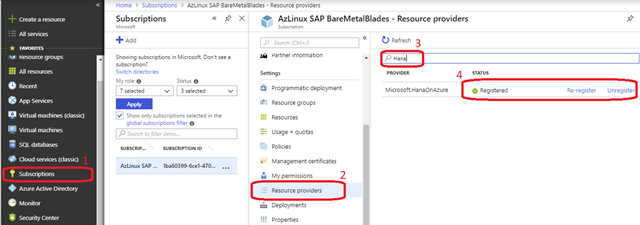
Or alternatively using the http://portal.azure.com. Go to your subscription that has HANA Large Instances, select “Resource Providers”, type “Hana” in the search box. Click on register.
Questions?
Send them to sap-hana@microsoft.com
Thursday, May 31, 2018
Deploy Cloud Dev Box on Azure with Terraform
Summary: See https://github.com/abhinababasu/cloudbox for a terraform based solution to deploy VMs in Azure with full remote desktop access.
Now the longer form :). I have blogged in the past about how to setup a Ubuntu desktop on Azure that you can RDP (remote desktop) into. Over the past few months I have moved onto doing most of my development work exclusively on cloud VM and I love having full desktop experience on my customized “Cloud Dev box”. I RDP into it from my dev box at work, Surface Pro, secure laptop etc.
I wanted to ensure that I can treat the box as cattle and not pet. So I came up with a terraform based scripts to bring up these cloud dev boxes. I have also shared them with my team in Microsoft and few devs are already using it. I hope it will be useful to you as well incase you want something like that. All code is at https://github.com/abhinababasu/cloudbox
A few things about the main terraform script at https://github.com/abhinababasu/cloudbox/blob/master/cloudVM.tf
- It is a good security practice is to ensure that your VM is locked down. I use Azure NSG rules to ensure that the VM denies in-bound traffic from Internet. I accept parameters to the script where you can give IP ranges which will then be opened up. This ensures that your VM is accessible from only safe locations, in my case those are IP ranges of Microsoft (from work) and my home IP address.
- While you can use just the TF file and setup script I have a driver script at https://github.com/abhinababasu/cloudbox/blob/master/cloudshelldeploy.sh that you might find useful
- Once the VM is created I use remote execution feature of terraform to run the script in https://github.com/abhinababasu/cloudbox/blob/master/cloudVMsetup.sh to install various software that I need including Ubuntu desktop and xrdp for remote desktop. This takes around 10 minutes atleast
- By default Standard_F8s machine is used, but that can be overridden with larger sizes (eg. Standard_F16s). I have found machines smaller than that doesn’t provide adequate performance. Note: You will incur costs for running these biggish VMs
Pre-requisite
Obviously you need terraform installed. I think the whole system works really well if you launch from https://shell.azure.com because that way all the credential stuff is automatically handled, and cloud shell comes pre-installed with terraform.
If you want to run from any other dev box, you can need to have Azure CLI and terraform installed (use installterraform.sh script for it) . Then do the following where subsId is the subscriptionId under which you want the VM to run.
az login az account set --subscription="<some subscription Id>"
While you can download the files from here and use it, you should be better of by customizing the cloudshelldeploy.sh script and then running it. I use the following to run
curl -O https://raw.githubusercontent.com/bonggeek/share/master/cloudbox/cloudshelldeploy.sh chmod +x cloudshelldeploy.sh ./cloudshelldeploy.sh abhinab <password>
Finally
Now you can use a rdp client like mstsc to loginto the machine.
NOTE: In my experience 1080p resolution works well, 4K lags too much to be useful. Since mstsc default is full-screen be careful if you are working on hi-res display and explicitly use 1080p resolution.
There I am logged into my cloud VM.
Tuesday, May 15, 2018
Getting Azure Cloud Location
I have had got some ask on how to discover which Azure cloud the current system is running on. Basically you want to figure out if you are running something in the Azure public cloud or in one of the specialized government clouds.
Unfortunately this is not currently available in Instance Metadata Service. However, it can be found out using a an additional call. The basic logic is to get the current location over IMDS and then call Azure Management API to see which cloud that location is present in.
Sample script can be found at https://github.com/bonggeek/share/blob/master/azlocation.sh
#!/bin/bash
locations=`curl -s -H Metadata:True "http://169.254.169.254/metadata/instance/compute/location?format=text&api-version=2017-04-02"`
# Test regions
#locations="indiasouth"
#locations="usgovsouthcentral"
#locations="chinaeast"
#locations="germanaycentral"
endpoints=`curl -s https://management.azure.com/metadata/endpoints?api-version=2017-12-01`
publicLocations=`echo $endpoints | jq .cloudEndpoint.public.locations[]`
if grep -q $locations <<< $publicLocations; then
echo "PUBLIC"
exit 1
fi
chinaLocations=`echo $endpoints | jq .cloudEndpoint.chinaCloud.locations[]`
if grep -q $locations <<< $chinaLocations; then
echo "CHINA"
exit 2
fi
usGovLocations=`echo $endpoints | jq .cloudEndpoint.usGovCloud.locations[]`
if grep -q $locations <<< $usGovLocations; then
echo "US GOV"
exit 3
fi
germanLocations=`echo $endpoints | jq .cloudEndpoint.germanCloud.locations[]`
if grep -q $locations <<< $germanLocations; then
echo "GERMAN"
exit 4
fi
echo "Unknown'
exit 0
This is what I see for my VM
Monday, March 26, 2018
Azure Serial Console
My team just announced the public preview of Azure Serial console. This has been a consistent ask from customers who want to recover VMs in the cloud. Go to your VM in http://portal.azure.com and then click on the Serial Console button
This opens a direct serial console connection to your VM. It is not required to have the VM open to internet. This is amazing to diagnose VM issues. E.g. if you are not able to SSH to the VM for some reason (blocked port, bad config change, busted boot config). You drop into the serial console and interact with your machine. Cool or what!!
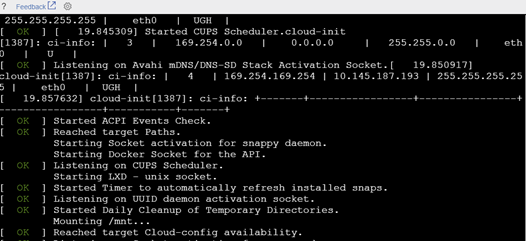
To show you the difference between a SSH connection and serial console, this is my machine booting up!!
Thursday, October 05, 2017
Remote Ubuntu desktop on Azure
For the past many months I have moved to have my dev boxes on the cloud. I am happily using a monster Windows VM and an utility Ubuntu desktop in the cloud. I realized after talking to a few people that they don’t realize how easy it is to setup Linux remote desktop in Azure cloud. Here goes the steps.
For VM configuration I needed a small sized VM with large enough network bandwidth to support remoting. Unfortunately on Azure you cannot choose networking bandwidth but rather all the VMs in a box gets networking bandwidth proportional to the number of cores they have. So I just created a VM based on the “Standard DS4 v2 Promo (8 vcpus, 28 GB memory)” and connected it to Microsoft ExpressRoute. If you are ok with public IP you skip setting the express route and ensure your VM has a public IP.
Then went to the Portal and enabled RDP. For that in the portal choose VM –> Networking and add rule to enable RDP.
Finally I sshed into my VM with
c:\bin\putty.exe abhinaba@AbhiUbuntu
Time to now install a bunch of tools
sudo apt-get update sudo apt-get install xrdp sudo apt-get install ubuntu-desktop sudo apt-get install xfce4 sudo apt-get update
Setup xsession
echo xfce4-session > ~/.xsession
Open the following file
sudo gvim /etc/xrdp/startwm.sh
Set the content to
#!/bin/sh
if [ -r /etc/default/locale ]; then
. /etc/default/locale
export LANG LANGUAGE
fi
startxfce4
start the xrdp service
sudo /etc/init.d/xrdp start
And then from my windows machine mstsc /v:machine_ip. I am presented with the login screen
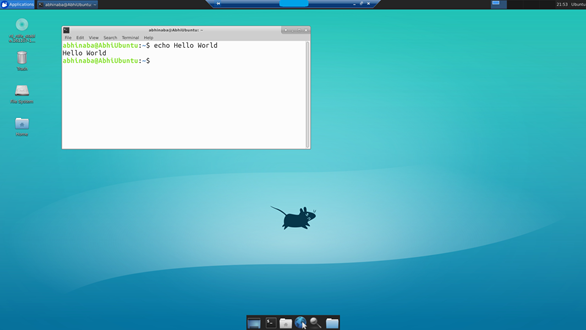
then I have full Ubuntu desktop on Azure :)
Wednesday, September 13, 2017
Distributed Telemetry at Scale
In Designing Azure Metadata Service I elaborated on how we run Azure Instance Metadata Service (IMDS) at massive scale. Running at this scale in 36 regions (at the time of writing) of the world, on incredible number of machines is a hard problem to solve in terms of monitoring and collecting telemetry. Unlike other centralized services it is not as simple as connecting it to a single telemetry pipeline and get done with it.
We need to ensure that
- We do not collect too much data (cost/latency)
- We do not collect too less (hard to debug issues)
- Data collection is fast
- We are able to drill down into specific issues and areas of problem
- Do all of the above when running in 36 regions of the world
- Continue to do all of the above as Azure continues it’s phenomenal growth
- Hot-path: Minimal numeric data that can be uploaded super fast (few second delayed) that we can use for monitoring our service and alert in case anomaly is detected
- Warm-path: More richer textual data that are few minute delayed and we can use this to drill down into issues remotely in case hot-path flagged an issue
- Cold-path: This gives us full fidelity data to monitor
Hot-Path
Even though we run on so many places we want to ensure that we have near real time alerting and monitoring and can quickly catch if something bad is happening. For that we use performance and functionality counters. These counters measure the type of response we are giving back, their latencies, data size etc. All of them are numeric and track each call in progress. We then have high speed uploaders in each machine with backends that can collect these. Then we attach these counters with alerts at per cluster level. We can catch latency issues, failures with few seconds delays. These counters only tell us if something is going bad and not why they are doing so. We have 10s of such numeric high speed telemetry coming from each IMDS instance.Here’s a snapshot of one such counter in our dashboard showing latency at 90th percentile.
In addition we have external dial-tone services that keep pinging IMDS to ensure the services are up everywhere. If there is no response then likely there has been some crash or other deadlocks. We measure the dial-tone as part of our up-time and also have alerts tied to this.
Warm-Path
If hot-path counter driven alerts tell us something has gone wrong and an on-call engineer is awaken, the next steps of business is to quickly figure out what’s going on. For that we use our warm-path pipeline. This pipeline uploads informational and error level logging. Due to volume the data is delayed by few minutes. The query granularity can also slow down fetching them. So one of the focus of the hot-path counters is that it can narrow down the location of problem to cluster level/machine level.The alert directly filters the logs being uploaded to a cluster/machine and brings up all logs. In most cases they are sufficient for us to detect issues. In case that doesn’t work we need to go into the detailed logs.
Cold-Path
Every line of logs (error/info/verbose) our service creates is stored locally on the machines with a certain retention policies. We have built tools so that given an alert an engineer can run a command from his dev box to fetch the log directly from that machine, wherever in the world the machine with the log exists. For hard to debug issues this is the last recourse.
However, more cooler is that we use our CosmosDB offering as a document store and store all error and info logs into that. This ensures the logs remain query-able for a long time (months) for reporting and analysis. We also run jobs that read the logs from these cosmos streams and then shove it into Kusto as structured data. Kusto is also available to users with the more fancier name of Azure Application Insights Analytics. I was floored with the insight we can get with this pipeline. We upload close to 8 terabytes of log data a day into cosmos and still able to query all data over months in a few seconds
Here’s a quick peek into seeing what kind of responses IMDS is handing out.
A look into the kinds of queries coming in.
Distribution of IMDS version being asked for.
We can extract patterns from the logs, run regex matching and all sorts of cool filters and at the same time be able to render data across our fleet in seconds.
Monday, September 11, 2017
Designing Azure Metadata Service
Some time back we have announced the general availability of Azure Instance Metadata Service (IMDS). IMDS has been designed to deliver instance metadata information into every IaaS virtual machines running on Azure over a REST endpoint. IMDS works as a data aggregation service and fetches data from various sources and surfaces it to the VM in a consistent manner. Some of the data can already be on the physical machine running the VM and others could be inside other regional service which are remote from the machine.
As you can imagine the scale of usage of this service is immense and spans across globe (at the time of writing 36 regions across the world) and Azure usage doubles YoY. So any design for IMDS has to be highly scalable and built for future growth.
We had many options to build this service both based on the various reliability parameters we wanted to hit as well as in terms of engineering ease.
Given a typical cloud hierarchical layout, you can imagine such a service to be built in any one of the following ways
- Build it like any other cloud service that runs on its own IaaS or PaaS infrastructure, with load-balancers, auto-scaling, mechanisms for distributing across regions, sharding etc.
- Dedicate machines in clusters or data centers that run this service locally
- Run micro-services directly in the physical machines that host the VMs
Initially building a cross region managed service seems like a simpler choice. Pick up any of the standard REST stack, deploy using any of the many deployment models available in Azure and go with that. With auto-scaling, load balancers it should just work and scale.
Like with any distributed systems we looked into our CAP model.
- Consistency: We could live with a more relaxed eventual consistency model for metadata. You can update the metadata of a virtual machines by making changes to it in the portal or using Azure CLI and eventually the virtual machine gets this last updated value
- Availability: The data needs to be highly available because various key pieces in the azure internal stack takes dependency on this metadata along with customer code running inside the VM
- Partition: The network is highly partitioned as is evident from the diagram above
Metadata of virtual machines is updated less frequently, however is used heavily across the stack (reads are much more common than updates). We needed to guarantee very high availability over a very highly partitioned infrastructure. We chose to optimize on partition tolerance and availability with eventual consistency. With that having a regional service was immediately discarded because it is not possible to provide high enough availability with that model.
Coupled with the above requirements and our existing engineering investments we chose to go with approach #3 of running IMDS as a micro service on each Azure host machine.
- Data is fetched and cached on every machine, which means that data is lower in liveliness but is always eventually consistent as data gets pushed into those machines. Varying levels of liveliness exists based on what specific source the metadata is fetched from. Some metadata anyway needs to be pushed into the machine before it is applied and is hence always live, others like say VM tags has lower liveliness guarantee
- Since the data is served from the same physical machine, the call doesn’t leave the machine at all and we can provide very high availability. Other than ongoing software deployments and system errors the data is always available. There is no network partition.
- There is no need to further balance load or shard out data because the data is on the machine where it is being served. The solution automatically scales with Azure because more customers means more Azure machines running them and more placed IMDS can run on
- However, deploying and telemetry at this scale is tough. Imagine how large Azure deployment is and consider deploying and updating a service that runs everywhere on it.
It’s really fun working on problems on this scale and it’s always a learning experience. I look forward to share more details on my blog here.
Friday, September 08, 2017
Azure Instance Metadata Service
One of the projects in Microsoft Azure that I have been involved with is the instance metadata service (IMDS) for Azure. It’s a massively distributed service running on Azure that among other things brings metadata information to IaaS virtual machines running on azure.
IMDS is documented at https://aka.ms/azureimds. Given that the API is already well documented at that location and like all services will evolve to encompass more scenarios in the future, I would not repeat that effort here. Rather I wanted to cover the background behind some of the decisions in the API design.
First lets look at the API itself and break it down to it’s essential elements
D:\>curl -H Metadata:True "http://169.254.169.254/metadata/instance?
api-version=2017-04-02&format=text" compute/ network/
Metadata API is REST based and available over a GET call at the non-routable IP address of 169.254.169.254. This IP is reserved in Azure for some time now and is also used for similar reasons in AWS. All calls to this API has to have the header Metadata:True. This ensures that the caller is not blindly forwarding an external call it received but is rather deliberately accessing IMDS.
All metadata is rooted under /metadata/instance. In the future other kinds of publicly available metadata could be made available under /metadata.
The Api-versions are documented in the link shared above and the caller needs to explicitly ask for a version, e.g. 2017-04-02. Interestingly it was initially named 2017-04-01, but someone in our team thought that it’s not a great idea to ship the first version of an API based on April fools day.
We did consider supporting something like “latest”, but experience tells us that it leads to fragile code. As versions will be updated, invariably some user’s scripts/code depending on latest to be of some form breaks. Moreover, it’s hard from our side to also gauge what versions are being used in the wild as users may just use latest but have implicit dependency on some of the metadata values.
We support two formats, JSON and text. On using JSON you can fetch the entire metadata and parse it on your side. A sample from Powershell screen shot is shared below.
However, we wanted to support a simple text based approach as well. It’s easiest to imagine the metadata as a DOM (document object model) or even a directory. On asking for text format at any level (the root being /metadata/instance) the immediate child data is returned. In the sample above the top level compute and network is returned. They are each in a given line and if that line ends with a slash, it indicates that the data has more children. Since compute/ was returned we can fetch it’s children by the following.
D:\>curl -H Metadata:True "http://169.254.169.254/metadata/instance/compute?api-version=2017-04-02
&format=text" location name offer osType platformFaultDomain platformUpdateDomain publisher sku version vmId vmSize
None of them have a “/” suffix and hence they are all leaf level data. E.g. we can fetch the unique id of the VM and the operating system type with the following calls
D:\>curl -H Metadata:True "http://169.254.169.254/metadata/instance/compute/vmId?
api-version=2017-04-02&format=text" c060492e-65e0-40a2-a7d2-b2a597c50343
D:\>curl -H Metadata:True "http://169.254.169.254/metadata/instance/compute/osType?
api-version=2017-04-02&format=text" Windows
The entire idea being that the API is usable from callers like bash-scripts or other cases that doesn’t want or need to pull in a JSON parser. The following bash script pulls the vmId from IMDS and displays it
vmid=$(curl -H Metadata:True "http://169.254.169.254/metadata/instance/compute/vmId?
api-version=2017-04-02&format=text" 2>/dev/null) echo $vmid
I have shared a few samples of using IMDS at https://github.com/bonggeek/Samples/tree/master/imds
Do share feedback and requests using the URL https://aka.ms/azureimds