Search

Showing posts with label .NET CF. Show all posts

Thursday, November 08, 2012

Windows Phone 8: Evolution of the Runtime and Application Compatibility

Long time back at the wake of the release of Windows Phone 7 (WP7) I posted about the Windows Phone 7 series programming model. I also published how .NET Compact framework powered the applications on WP7.

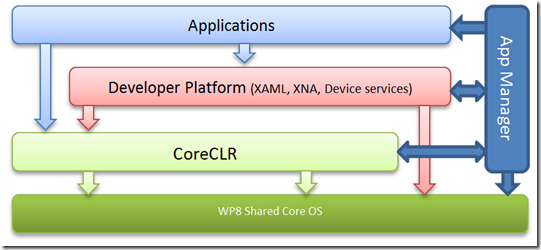
Further simplifying the block diagram, we can think of the entire WP7 application system as followsimage

As with most block diagrams, this is gross simplifications. However, I hope it helps to easily picture the entire system.

Essentially the application can be purely managed (written in say C# or VB.net). The application can only utilize services exposed by the developer platform and core services provided by .NET Compact Framework. The application can in no way directly use native code or talk to the OS (say call an Win32 API). It has to always go through the runtime infrastructure and is in a security sandbox.

The application manager is the loose term I am using to encompass everything that is used to managed the application including the host.

Windows Phone 8 (WP8) is a huge huge change from Windows Phone 7.x (WP7). From the perspective of a WP7 application running on a WP8 device the system looks as follows

image

Everything in Green in this diagram got outright replaced with entire new codebase and the rest of the system other than the application was heavily modified to work with the new OS and the new managed runtime.

Shared Windows Core

The OS moved away from Windows Compact Embedded (WinCE) OS core that was used in WP7 to a new OS which shares it’s core with the desktop Windows 8. This means that a bunch of things in the WP8 OS is shared with the desktop implementation, this includes things like kernel, networking, driver framework and others. The shared core obviously brings great value as innovations and features will more easily flow across the two form factors (device and desktop) and also reduce engineering redundancy on Microsoft side. Some of the benefits are readily visible today like great multi-core support, WinRT interop and others are more subtle.

CoreCLR

.NET Compact Framework (NETCF) that was used in WP7 has a very different design philosophy and hence a completely different implementation from the desktop .NET. I will have a follow up post on this but for now it suffices to note that .NETCF is a very portable runtime that is designed to be very versatile and cross platform. Desktop CLR on the other hand is more closely tied with Windows and the processor architecture. It closely works with the OS and the underlying HW to give the maximum performance benefit to managed code running on it.

With the new Windows RT which works on ARM, desktop CLR was anyway updated to work on the ARM processor. So when the phone chose to move to shared core it was an obvious choice to move the CLR as well. This gave the same benefits of shared innovation and reduced engineering redundancy.

The full desktop CLR is more heavy and provides functionality that is not really required by the phone scenarios and hence a lighter variant of it (which is built from the same source) called CoreCLR was chosen for WP8. CoreCLR is the evolution of the lightweight runtime that powered Silverlight. With the move to CoreCLR developers get a much faster runtime with extended feature set that includes interop via WinRT.

Backward Compat

One of the simple statements made during all of these WP8 launch presentations was that applications in the store built for WP7 will work as is for WP8. This is a small statement but is a huge achievement and effort from the runtime implementation perspective. Making apps work as is when the entire runtime, OS and chipset has changed is non-trivial to say the least. Our team worked very hard to make this possible.

One of the biggest things that played out to our benefit was that the WP7 apps were fully sandboxed and couldn’t use any native code. This means that they didn’t have any means of taking behavioral dependence on the OS APIs or underlying HW. The OS APIs were used via the CLR and it could always add quirks to expose consistent behavior to the applications.

API Compatibility
This required us to ensure that CoreCLR exposes the same API set as NETCF. We ran various automated tools to managed API surface area changes and retain meaningful API compat between WP7 and WP8. With a closed application store it was possible for us to gather complete metrics on API usage and correctly prioritize engineering resources to ensure that majority of applications continued to see the same API set in signature and semantics.

We also needed to ensure that the same APIs behave as closely as possible with that provided by NETCF. We tested a lot of applications in the app store to get as close as we can and believe that we are at a place that should allow most WP7 application’s API usage to transparently fall over to the new runtime.

Runtime behavior changes
When a runtime changes there are behavioral changes that can expose pre-existing issues with applications. This includes things like timing differences. Even though these runtime behaviors are not documented, or in some cases especially called out that user code should not take dependence on them, some apps still did do that.

Couple of the examples we saw

  1. Taking dependence on finalization order
    Even though CLI specification clearly calls out that finalization order in .NET is not deterministic, code still took subtle dependency on them. In one particular case object F1 used a file and it’s finalizer released it. Later another object F2 opens the same file. With change in the runtime, the timing of GC changed so that at the time F2 tried to open the file, F1 which has been already collected hasn’t yet had its finalizer run. Hence the application crashed. We got in touch with the app developer and got the code moved to use the right dispose pattern/
  2. GC Timing and changes in number of generations
    Application finalizers contrary to .NET guidelines modified other managed objects. Now changed GC timings and generation resulted in those objects to have already been collected and hence resulted in finalizer crashes
  3. Threading issues
    This was one of the painful ones. With the change in OS and hence thread scheduler and addition of multiple cores in the ARM CPU, a lot of subtle races and deadlocks in the applications got exposed. These were pre-existing issues where synchronization primitives were not used correctly or some code relied on the quanta based thread scheduling WinCE did. With move to WP8, threads run in parallel on different cores and scheduled in different order, this lead to various deadlocks and race driven crashes. Again we had to get in touch with app developer to address these issues
  4. There were other cases where exact precision of floating point math was relied on. This resulted in a board game where pucks flew off from its surface
  5. Whether or not functions got inlined
  6. Order of static constructor initialization (especially in conjunction of function in lining)

We addressed some of these issues where it was realistic to fix them in the runtime. For some of the others we got in touch with the application developers. Obviously all applications in the store and all of their features were not tested. So you should try to test your applications when you have access to WP8.

At one point we were all playing games on our phones telling our managers that I am compat testing Need For Speed and I need to test till level 10 :)

Tuesday, October 16, 2012

Test Driven Development of a Generational Garbage Collection

Crater Lake, OR panorama

These days everyone is talking about being agile and test driven development (TDD). I wanted to share a success story of TDD that we employed for developing Generational Garbage Collector (GC) for Windows Phone Mango.

The .NET runtime on Windows Phone 7 shipped with a mark-sweep-compact; stop the world global non-generational GC. Once a GC was triggered, it stopped all managed execution and scanned the entire managed heap to look up all managed references and cleaned up objects that were not in use. Due to performance bottleneck we decided to enhance the GC by adding a generational GC (referred to as GenGC). However, post the General Availability or GA of WP7 we had a very short coding window. Replacing such a fundamental piece of the runtime in that short window was very risky. So we decided to build various kinds of stress infrastructure first, and then develop the GC. So essentially

  1. Write the tests
  2. See those tests failing
  3. Write code for the generational GC
  4. Get tests to pass
  5. Use the tests for regression tracking as we refactor the code and make it run faster

Now building tests for a GC is not equivalent of traditional testing of features or APIs where you write tests to call into mocked up API, see it fail until you add the right functionality. Rather these tests where verifications modes and combination of runtime stresses that we wrote.

To appreciate the testing steps we took do read the Back To Basics: Generational Garbage Collection and WP7 Mango: Mark-Sweep collection and how does a Generational GC help posts

Essentially in a generational GC run all of the following references should be discovered by the GC

  1. Gen0 Objects reachable via roots (root –> object OR recursively root –> object –> object )
  2. Objects accessible from runtime native code (e.g. pinned for PInvoke, COM interop, internal runtime references)
  3. Objects referenced via Gen1 –> Gen0 pointers

The first two were anyway heavily covered by our traditional GC tests. #3 being the new area being added.

To implement a correct generational GC we needed to ensure that at all places in the runtime where managed object references are updated they need to get reflected in the CardTable (#3 above). This is a daunting task and prone to bugs via omission as we need to ensure that

  1. All forms of assignments in MSIL that we JIT there are calls to update the CardTable.
  2. All places in the native runtime code where such references are directly and or indirectly updated the same thing is ensured. This includes all JIT worker-routines, COM, Marshallers.

If a single instance is missed then it would result in valid/reachable Gen0 objects being collected (or deleted) and hence in the longer run result in memory corruption, crashes that will be hard if not impossible to debug. This was assessed to be the biggest risk to shipping generational GC.

The other problem is that these potential omissions can be only exposed by certain ordering of allocation and collection. E.g. only a missing tracked reference of A –> B can result in a GC issue only if a GC happened in between allocations of A and B (A is in higher generation than B). Also due to performance reasons (write atomicity for lock-less updates) for every assignment of A = B we do not update the card-table bit that covers the memory area of A. Rather we update the whole byte in the card-table. This means an update to A will cover other objects allocated adjacent to A. Hence if an update to an object just beside A in the memory is missed it will not be discovered until some other run where that object lands up being allocated farther away from A.

GC Verification mode

Our solution to all of these problems was to first create the GC verification mode. What this mode does is runs the traditional full mark-sweep GC. While running that GC it goes through all objects in the memory and as it traverses them for every reference A (Gen1) –> B(Gen0), it verifies that the card table bit for A is indeed set. This ensures that if a GenGC was to run, it would not miss that references

Granular CardTable

We used very high granular card-table resolution for test runs. For these special runs each bit of the card-table corresponded to almost one object (1 bit to 2 byte resolution). Even though the card-table size exploded it was fine because this wasn’t a shipping configuration. This spaced out objects covered by the card-table and exposed adjacent objects not being updated.

GC Stress

In addition we ran the GC stress mode, where we made the GC run extremely frequently (we could push it up to a GC in every allocation). The allocator was also updated to ensure that allocations were randomized so that objects moved around everywhere in the memory.

Hole Finder

Hole finder moves all objects around in memory after a GC. This exposes stale pointer issues. If an object didn’t get updated properly due to the GC it would now point to invalid memory because all previous memory locations are now invalid memory. So a subsequent write will fail-fast with AV and we can easily detect that point of failure.

With all of these changes we ran the entire test suites. Also by throttling down the GC Stress mode we could still use the runtime to run real apps on the phone. Let me tell you playing NFS on a device with the verification mode, wasn’t fun :)

With this precaution we ensured that not a single GenGC bug has come in from the phone. It shipped rock solid and we were more confident with code churn because regressions would always be caught. I actually never blogged about this because I felt that if I do, it’ll jinx something :)

WP7: CLR Managed Object overhead

Winter day

A reader contacted me over this blog to inquire about the overhead of managed objects on the Windows Phone. which means that when you use an object of size X the runtime actually uses (X + dx) where dx is the overhead of CLR’s book keeping. dx is generally fixed and hence if x is small and there are a lot of those objects it starts showing up as significant %.

There seems to be a great deal of information about the desktop CLR in this area. I hope this post will fill the gap for NETCF (the CLR for the Windows Phone 7)

All the details below are implementation detail and is provided just as guidance. Since these are not mandated by any specification (e.g. ECMA) they may and most probably will change.

General layout

The overhead varies on the type of objects. However, in general the object layout looks something like

imageSo internally just before the actual object there is a small object-header. If the object is a finalizable object (object with a finalizer) then there’s another 4-byte pointer at the end of the object. 
The exact size of the header and what's inside that header depends on the type of the object.

Small objects (size < 16KB)

All objects smaller than 16KB has a 8 byte object header.image

The 32-bits in the flag are used to store the following information

  1. Locking
  2. GC information. E.g.
    1. Bits to mark objects
    2. Generation of the object
    3. Whether the object is pinned
  3. Hashcode (for GetHashCode support)
  4. Size of the object

Since all objects are 4 byte aligned, the size is stored as an unit of 4 bytes and uses 11 bits. Which means that the maximum size that can be stored in that header is 16KB.

The second flag contains a 32-bit pointer to the Class-Descriptor or the type information of that object. This field is overloaded and is also used by the GC during compaction phase.

Since the header cost is fixed, the smaller the object the larger the overhead becomes in terms of % overhead.

Large Objects

As we saw in the previous section that the standard object header supports describing 16KB objects. However, we do need to support larger objects in the runtime.

This is done using a special large-object header which is 20 bytes.image

The overhead of large object comes to be at max of around 0.1%. A dedicated 32-bit size field allows the runtime to support very large objects (close to 2GB).

It’s weird to see that the normal object header is repeated twice. The reason is that very large objects are rare on the phone. Hence the runtime tries to optimize it’s various operations so that the large object doesn’t bring in additional code paths and checks. Given an object reference having the normal header just before it helps us in speeding various operations. At the same time having the header as the first data-structure of all objects helps us to be faster in other cases. Bottom line is that the additional 8 bytes or 0.04% extra space usage helps us in enough performance gains at other places so that we pay that extra overhead cost.

Pool overhead

NETCF uses 64KB object pools and then sub-allocates objects from it. So in addition to the per-object overhead it uses an additional 44-byte of object-pool-header per 64kb. This means another 0.06% overhead per 64KB. For every object, the contribution of this can be ignored.

Arrays

Arrays pan out slightly differently.

image

In case of value type array every member doesn’t really need to have the type information and hence the object header associated with it. The Array header is a standard object header of 8 bytes or big object header of 20bytes (based on the size of the array). Then there is a 32-bit count of the number of elements in the array. For single dimension array there is no more overhead. However, for higher dimension arrays the length in each dimension is also stored to support runtime bounds check.

The reference type arrays are similar but instead of the array contents being inlined into the array the elements are references to the objects on the managed heap and each of those objects have their standard headers.

Putting it all together

Standard object 8 bytes ( + 4 bytes for finalizable object)
Large objects (>16KB) 20 bytes ( + 4 bytes for finalizable object)
Arrays object overhead + 4 bytes array header + (nDimension x 4 bytes)

Thursday, October 27, 2011

Windows Phone Mango: Under the hood of Fast Application Switch

spin

Fast Application Switch of FAS is kind of tricky for application developers to handle. There are a ton of documentation around how the developers need to handle the various FAS related events. I really liked the video http://channel9.msdn.com/Events/DevDays/DevDays-2011-Netherlands/Devdays059 which walks through the entire FAS experience (jump to around 8:30).

In this post I want to talk about how the CLR (Common Language Runtime or .NET runtime) handles FAS and what that means to your application. Especially the Active –> Dormant –> Active flow. Most of the documentation/presentation quickly skips over this with the vague “The application is made dormant”. This is equivalent to the “witches use brooms to fly”. What is the navigation mechanism or how the broom is propelled are the more important questions which no one seems to answer (given the time of year, I just couldn’t resist :P) . Do note that most developers can just follow the coding guidelines for FAS and never need to care about this. However, a few developers, especially the ones developing multi-threaded apps and using threading primitives may need to care about this. And hence this post

Design Principle

The entire Multi-threading design was made to ensure the following

Principle 1: Pre-existing WP7 apps shouldn’t break on Mango.
Principle 2: When an application is sent to the background it shouldn’t consume any resources
Principle 3: Application should be resumed fast (hence the name FAS)

As you’d see that these played a vital role in the design being discussed below.

States

The states an application goes through is documented in http://msdn.microsoft.com/en-us/library/ff817008(VS.92).aspx 

Execution Model Diagram for Windows Phone 7.5

CLR Design

The diagram below captures the various phase that are used to rundown the application to make it dormant and later re-activated.  It gives the flow of an application as it goes through the Active –> Dormant –> Active state (e.g. the application was running and the user launches another application and then uses the back button to go back to the first application).

image

Deactivated

The Deactivated event is sent to the application to notify it that the user is navigating away from the application. After this there is 3 possible outcomes. It will either remain dormant, gets tombstoned or finally gets killed as well. Since there is no way to know which would happen, the application should store its transient state into the PhoneApplicationPage.State and it’s persistent state into some persistent store like the IsolatedStorage or even in the cloud. However, do note that the application has 10 seconds to handle the Deactivated event. In the 3 possible situations this is how the stored data will be used back

  1. Deactivate –> Dormant –> Active
    In this situation the entire process was intact in memory and just it’s execution was stopped (more about it below). In the Activated event the application can just check the IsApplicationInstancePreserved property. If this is true then the application is coming back from Dormant state and can just use the in-memory state. Nothing needs to be re-read in.
  2. Deactivate –> Dormant –> Tombstoned –> Active
    In this case the application’s in-memory state is gone. However, the PhoneApplicationPage.State is serialized back. So the application should read persistent user data from IsolatedStorage or other permanent sources in the Activated event. At the same time it case use the PhoneApplicationPage.State in the OnNavigatedTo event.
  3. Deactivate –> Dormant –> Terminated
    This case is no different from the application being re-launched. So in the Launching event the user data needs to be re-created from the permanent store. PhoneApplicationPage.State  is empty in this case

The above supports the #1 principle of not breaking pre-existing WP7 apps. A WP7 app would’ve been designed without considering the dormant stage. Hence it would’ve just skipped the #1 option. So the only issue will be that a WP7 app will result in re-creating the application state each time and not get the benefit of the Dormant stage (it will get the performance of Tombstoning but not break in Mango).

Post this event the main thread never transitions to user code (e.g. no events are triggered). The requirement on the application for deactivate is that

  1. It shouldn’t run any user code post this point. This means it should voluntarily stop background threads, cancel timers it started and so on
  2. This event needs to be handled in 10 seconds

If app continues to run code, e.g. in another thread and modifies any application state then that state cannot be persisted (as there will be no subsequent Deactivated type event)

Paused

This event is an internal event that is not visible to the application. If the application adhered to the above guideline it shouldn’t care about it anyway.

The CLR does some interesting stuff on this event. Adhering to the “no resource consumption” principle is very important. Consider that the application had used ManualResetEvent.WaitOne(timeout). Now this timeout can expire in the time when the application was dormant. If that happened it would result in some code running when the application is dormant. This is not acceptable because the phone maybe behind locked screen and this context switch can get the phone out of a low-power state. To handle this the runtime detaches Waits, Thread.Sleep at Paused. Also it cancels all Timers so that no Timer callbacks happen post this Pause event.

Since Pause event is not visible to the application, it should consider that some time post Deactivated this detach will happen. This is completely transparent to user code. As far as the user code is considered, it just that these handles do not timeout or sleeps do not return during the time the application is dormant. The same WaitHandle objects or Thread.Sleeps start working as is after the application is activated (more about timeout adjustment below).

This is also the place where other parts of the tear-down happens. E.g. things like asynchronous network calls cancelled, media is stopped.

Note that the background user threads can continue to execute. Obviously that is a problem because the user code is supposed to voluntarily stop them at Deactivated.

Freeze

Besides user code there are a lot of other managed code running in the system. These include but not limited to Silverlight managed code, XNA managed code. Sometime after Paused all managed code is required to stop. This is called the CLRFreeze. At this point the CLR freezes or blocks all managed execution including user background threads. To do that it uses the same mechanism as used for foreground GC. In a later post I’d cover the different mechanics NETCF and desktop CLR uses to stop managed execution.

Around freeze the application enters the Dormant stage where it’s in 0 CPU utilization mode.

Thaw

Managed threads stopped at Freeze are re-started at this point.

Resuming

At Resuming the WaitHandle, Thread.Sleep detached in Paused is re-attached. Also timeout adjustments are made during this time. Consider that the user had two handles on which the user code started Waits with 5 seconds and 10 seconds timeouts. After 3 seconds of starting the Waits the application is made dormant. When the application is re-activated, the Waits are restarted with the amount of timeout remaining at the point of the application getting deactivated. So essentially in the case below the first Wait is restarted with 2 seconds and the later with 7. This ensures that relative gap between Sleeps, Waits are maintained.

image

Note timers are still not restarted.

Activated

This is the event that the application gets and it is required to re-build it’s state when the activation is from Tombstone or just re-use the state in memory when the activation is from Dormant stage.

Resumed

This is the final stage or FAS. This is where the CLR restarts the Timers. The idea behind the late start of timers is that they are essentially asynchronous callbacks. So the callbacks are not sent until the application is activated (built its state) and ready to consume those callbacks.

Conclusion

  1. Ideally application developer needs to take care of the FAS by properly supporting the various events like Deactivated, Activated
  2. Background threads continue to run post the Deactivated event. This might lead to issues by corrupting application state and losing state changes. Handle this by terminating the background threads at Deactivated
  3. While making application dormant Waits, Sleeps and Timers are deactivated. They are later activated with timeout adjustments. This happens transparently to user code
  4. Not all waiting primitives are time adjusted. E.g. Thread.Join(timeout) is not adjusted.

Tuesday, June 14, 2011

WP7 Mango: The new Generational GC

In my previous post “Mark-Sweep collection and how does a Generational GC help” I discussed how a generational Garbage Collector (GC) works and how it helps in reducing collection latencies which show up as long load times (startup as well as other load situations like game level load) and gameplay or animation jitter/glitches. In this post I want to discuss how those general principles apply to the WP7 Generational GC (GenGC) specifically.

Generations and Collection Types

We use 2 generations on the WP7 referred to as Gen0 and Gen1. A collection could be any of the following 4 types

  1. An ephemeral or Gen0 collection that runs frequently and only collects Gen0 objects. Object surviving the Gen0 collection is promoted to Gen1
  2. Full mark-sweep collection that collects all managed objects (both Gen1 and Gen0)
  3. Full mark-sweep-compact collection that collects all managed objects (both Gen1 and Gen0)
  4. Full-GC with code-pitch. This is run under severe low memory and can even throw away JITed code (something that desktop CLR doesn’t support)

The list above is in the order of increasing latency (or time they take to run)

Collection triggers

GC triggers are the same and as outlined in my previous post WP7: When does the GC run. The distinction between #2 and #3 above is that at the end of all full-GC the collector considers the memory fragmentation and can potentially run the memory compactor as well.

  1. After significant allocation
    After significant amount of managed allocation the GC is started. The amount today is 1MB (called GC quanta) but is open to change. This GC can be ephemeral or full-GC. In general it’s an ephemeral collection. However, it might be a full collection under the following cases
    1. After significant promotion of objects from Gen0 to Gen1 the collections become full collections. Today 5MB of promotion triggers a full GC (again this number is subject to change).
    2. Application’s total memory usage is close to the maximum memory cap that apps have (very little free memory left). This indicates that the application will get terminated if the memory utilization is not cut-back.
    3. Piling up of native resources. We use different heuristics like native to managed memory ratio and finalizer queue heuristics to detect if GC needs to turn to full collection to release native resources being held-up due to Gen0 only collections
  2. Resource allocation failure
    All resource allocation failure means that the system is under memory pressure and hence such collections are always full collection. This can lead to code pitch as well
  3. User code triggered GC
    User code can start collections via the System.GC.Collect() managed API. This results in a full collection as documented by that API. We have not added the method overload System.GC.Collect(generation). Hence there is no way for the developer to start a ephemeral or Gen0 only collection
  4. Sharing server initiated
    Sharing server can detect phone wide memory issue and start GC in all managed processes running. These are full-GC and can potentially pitch code as well.


So from all of the above, the 3 key takeaways are

  1. Low memory or memory cap related collections are always full-collections. These could also turn out to be the more costly compacting collection and/or pitch JITed code
  2. Collections are in general ephemeral and become full-collection after significant object promotion
  3. No fundamental changes to the GC trigger policies. So an app written for WP7 will not see any major changes to the number of GC’s that happen. Some GC will be ephemeral and others will be full-GCs.


Write Barriers/Card-table

As explained in my previous post, to keep track of Gen1 to Gen0 reference we use write-barrier/card-table.

Card-table can be visualized as a memory bitmap. Each bit in the card-table covers n bytes of the net address space. Each such bit is called a Card. For managed reference updates like  A.b = C in addition to JITing the real assignment, calls are added to Write-barrier functions. This  write barrier locates the Card corresponding to the address of write and sets it. Later during collection the collector checks all Gen-1 objects covered by a set card-bit and marks Gen-0 references in those objects.

This essentially brings in two additional cost to the system.

  1. Memory cost of adding those calls to the WB in the JITed code
  2. Cost of executing the write barrier while modifying reference

Both of the above are optimized to ensure they have minimum execution impact. We only JIT calls to WB when absolutely required and even then we have an overhead of a single instruction to make the call. The WB are hand-tuned assembly code to ensure they take minimum cycles. In effect the net hit on process memory due to write barriers is way less than 0.1%. The execution hit in real-world applications scenarios is also not in general measureable (other than real targeted testing).

Differences from desktop

In principle both the desktop GC and the WP7 GC are similar in that they use mark-sweep generational GC. However, there are differences based on the fact that the WP7 GC targets a more constrained device.

  1. 2 generations as opposed to 3 on the desktop
  2. No background or incremental collection supported on the phone
  3. WP7 GC has additional logic to track and handle application policies like application memory caps and total memory utilization
  4. The phone CLR uses a very different memory layout which is pooled and not linear. So no concept of Large Object Heap. So lifetime of large objects is no different
  5. No support for particular generation collection from user code

Wednesday, June 08, 2011

WP7 Mango: Mark-Sweep collection and how does a Generational GC help

About a month back we announced that in the next release of Windows Phone 7 (codenamed Mango) we will ship a new garbage collector in the CLR. This garbage collector (GC) is a generational garbage collector.

This post is a “back to basics” post where I’ll try to examine how a mark-sweep GC works and how adding generational collection helps in boosting it’s performance. We will take a simplified look at how mark-sweep-compact GC works and how generational GC can enhance it’s performance. In later posts I’ll try to elaborate on the specifics of the WP7 generational GC and how to ensure you get the best performance out of it.

Object Reference Graph

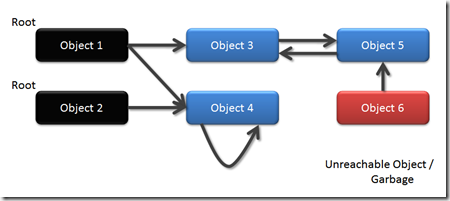
Objects in the memory can be considered to be a graph. Where every object is a node and the references from one object to another are edges. Something like

image

To use an object the code should be able to “reach” it via some reference. These are called reachable objects (in blue). Objects like a method’s local variable, method parameters, global variables, objects held onto by the runtime (e.g. GCHandles), etc. are directly reachable. They are the starting points of reference chains and are called the roots (in black).

Other objects are reachable if there are some references to them from roots or from other objects that can be reached from the roots. So Object4 is reachable due to the Object2->Object4 reference. Object5 is reachable because of Object1->Object3->Object5 reference chain. All reachable objects are valid objects and needs to be retained in the system.

On the other hand Object6 is not reachable and is hence garbage, something that the GC should remove from the system.

Mark-Sweep-Compact GC

A garbage collector can locate garbage like Object6 in various ways. Some common ways are reference-counting, copying-collection and Mark-Sweep. In this section lets take a more pictorial view of how mark-sweep works.

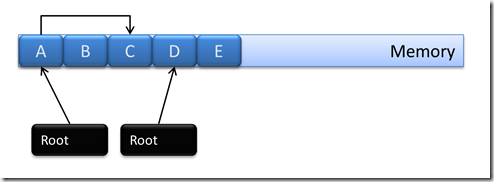
Consider the following object graph

1

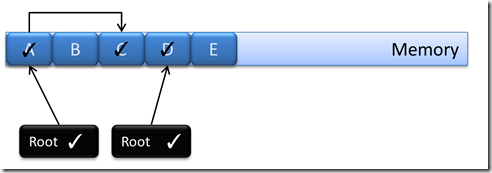
At first the GC pauses the entire application so that the object graph is not being mutated (as in no new objects or references are being created). Then it goes into the mark phase. In mark phase the GC traverses the graph starting at the roots and following the references from object to object. Each time it reaches an object through a reference it flips a bit in the object header indicating that this object is marked or in other words reachable (and hence not garbage). At the end everything looks as follows

2

So the 2 roots and the objects A, C, D are reachable.

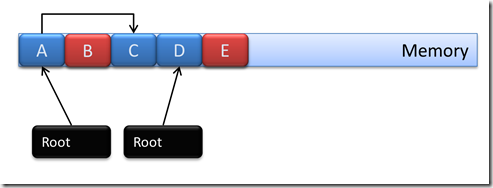
Next it goes into the sweep phase. In this phase it starts from the very first object and examines the header. If the header’s mark bit is set it means that it’s a reachable object and the sweep resets that bit. If the header’s bit is not set, it’s not reachable and is flagged as garbage.

3

So B and E gets flagged as garbage. Hence these areas are free to be used for other objects or can be released back to the system

4

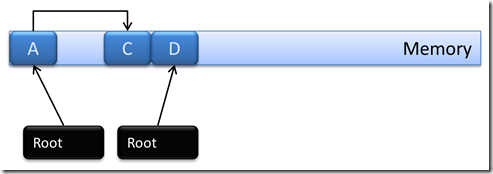
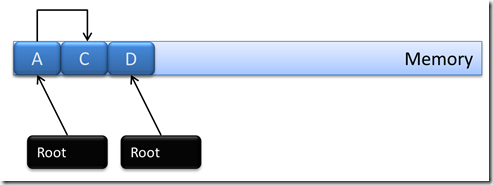
This is where the GC is done and it may resume the execution of the application. However, if there are too many of those holes (released objects) created in the system, then the memory gets fragmented. To reduce memory fragmentation. The GC may compact the memory by moving objects around. Do note that compaction doesn’t happen for every GC, it is run based on some fragmentation heuristics.

5

Both C and D is moved here to squeeze out the hole for B. At the same time all references to these objects in the system is also update to point to the correct location.

One important thing to note here is that unlike native objects, managed objects can move around in memory due to compaction and hence taking direct references to it (a.k.a memory pointers) is not possible. In case this is ever required, e.g. a managed buffer is passed to say the microphone driver native code to copy recorded audio into, the GC has to be notified that the corresponding managed object cannot be moved during compaction. If the GC runs a compaction and object moves during that microphone PCM data copy, then memory corruption will happen because the object being copied into would’ve moved. To stop that, GCHandle has to be created to that object with GCHandleType.Pinned to notify the GC that the corresponding object should never move.

On the WP7 the interfaces to these peripherals and sensors are wrapped by managed interfaces and hence the WP7 developer doesn’t really have to do these things, they are taken care offm under the hood by those managed interfaces.

The performance issue

As mentioned before during the entire GC the execution of the application is stopped. So as long as the GC is running the application is frozen. This isn’t a problem in general because the GC runs pretty fast and infrequently. So small latencies of the order of 10-20ms is not really noticeable.

However, with WP7 the capability of the device in terms of CPU and memory drastically increased. Games and large Silverlight applications started coming up which used close to 100mb of memory. As memory increases the number of references those many objects can have also increases exponentially. In the scheme explained above the GC has to traverse each and every object and their reference to mark them and later remove them via sweep. So the GC time also increases drastically and becomes a function of the net workingset of the application. This results in very large pauses in case of large XNA games and SL applications which finally manifests as long startup times (as GC runs during startup) or glitches during the game play/animation.

Generational Approach

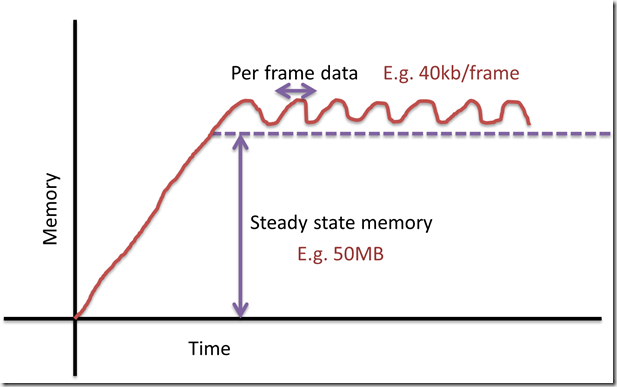
If we take a look at a simplified allocation pattern of a typical game (actually other apps are also similar), it looks somewhat like below

image

The game has a large steady state memory which contains much of it’s steady state data (which are not released) and then per-frame it goes on allocating/de-allocating some more data, e.g. for physics, projectiles, frame-data. To collect this memory layout the traditional GC has to walk or traverse the entire 50+ mb of data to locate the garbage in it. However, most of the data it traverses will almost never be garbage and will remain in use.

This application behavior is used for the Generational GC premise

  1. Most objects die young
  2. If an object survives collection (that is doesn’t die young) it will survive for a very long time

Using these premise the generational GC tries to segregate the managed heap into older and younger generations objects. The younger generation called Gen-0 is collected in each GC (premise 1), this is called the Ephemeral or Gen0 Collection. The older generation is called Gen-1. The GC rarely collects the Gen-1 as the probability of finding garbage in it is low (premise 2).

image

So essentially the GC becomes free of the burden of the net working set of the application.

Most GC will be ephemeral GC and it will only traverse the recently allocated objects, hence the GC latency remains very low. Post collection the surviving objects are promoted to the higher generation. Once a lot of objects are promoted, the higher generation starts becoming full and then a full collection is run (which collects both gen-1 and gen-0). However, due to premise 1, the ephemeral collection finds a lot of garbage in their runs and hence promotes very few objects. This means the growth rate of the higher generation is low and hence full-collection will run very infrequently.

Ephemeral/Gen-0 collection

Even in ephemeral collection the GC needs to deterministically find all objects in Gen-0 which are not reachable. This means the following objects needs to survive a Gen-0 collection

  1. Objects directly reachable from roots
  2. Root –> Gen0 –> Gen-0 objects (indirectly reachable from roots)
  3. Objects referenced from Gen1 to Gen0

Now #1 and #2 pose no issues as in the Ephemeral GC, we will anyway scan all roots and Gen-0 objects. However to find objects from Gen1 which are referencing objects in Gen-0, we would have to traverse and look into all Gen1 objects. This will break the very purpose of having segregating the memory into generation. To handle this write-barrier+card-table technique is used.

The runtime maintains a special table called card-table. Each time any references are taken in the managed code e.g. a.b = c; the code JITed for this assignment also updates an internal data-structure called CardTable to capture that write. Later during the ephemeral collection, the GC looks into that table to find all the ‘a’ which took new references. If that ‘a’ is a gen-1 object and ‘c’ a gen-0 object then it marks ‘c’ recursively (which means all objects reachable from ‘c’ is also marked). This technique ensures that without examining all the gen-1 objects we can still find all live objects in Gen-0. However, the cost paid is

  1. Updating object reference is a little bit more costly now
  2. Making old object taking references to new objects increases GC latency (more about these in later posts)

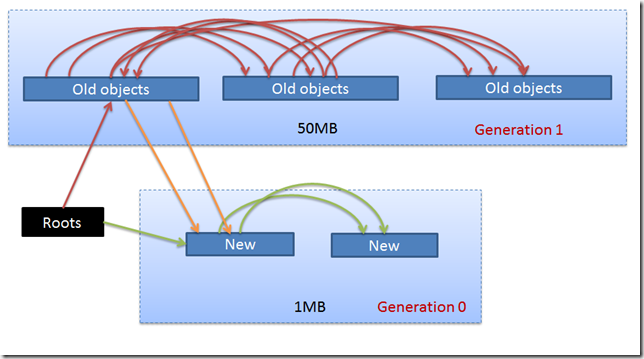
Putting it all together, the traditional GC would traverse all references shown in the diagram below. However, an ephemeral GC can work without traversing the huge number of Red references.

image

It scans all the Roots to Gen-0 references (green) directly. It traverses all the Gen1->Gen0 references (orange) via the CardTable data structure.

Conclusion

  1. Generational GC reduces the GC latency by avoiding looking up all objects in the system
  2. Most collections are gen-0 or ephemeral collection and are of low latency this ensures fast startup and low latency in game play
  3. However, based on how many objects are being promoted full GC’s are run sometimes. When they do, they exhibit the same latency as a full GC on the previous WP7 GC

Given the above most applications will see startup and in-execution perf boost without any modification. E.g today if an application allocates 5 MB of data during startup and GC runs after every MB of allocation then it traverses 15mb (1 + 2 + 3 + 4 + 5). However, with GenGC it might get away with traversing as low as only 5mb.

In addition, especially game developers can optimize their in-gameplay allocations such that during the entire game play there is no full collection and hence only low-latency ephemeral collections happens.

How well the generational scheme works depend on a lot of parameters and has some nuances. In the subsequent posts I will dive into the details of our implementation and some of the design choices we made and what the developers needs to do to get the most value out of it.

Thursday, July 29, 2010

Windows Phone 7 App Development: When does the GC run

Cub

Many moons ago I made a post on When does the .NET Compact Framework Garbage Collector run. Given that a lot of things have changed since then, it’s time to make another post about the same thing.

For the developers coming to Windows Phone 7 (WP7) from the Windows desktop let me first clarify that the runtime (CLR) that is running on the WP7 is not the same as the one running on the desktop. The WP7 runtime is known as .NET Compact Framework (NETCF) and it works differently than the “desktop CLR”. For 90% of cases this is irrelevant as the WP7 developer targets the XNA or Silverlight programming model and hence what is running underneath is really not important. E.g when you drive you really do not care about the engine. This post is for the other 5% where folks do run into issues (smoke coming out of the car).

Moreover do note that when the GC is run is really an implementation detail that is subject to change.

Now that we have all the disclaimers behind us lets get down to the list.

The Garbage Collector is run in the following situations

  1. After some significant allocation:
    When an application tries to allocate managed memory the allocator first checks a counter that indicates the number of bytes of managed data allocated since the last GC. If this counter crosses a threshold (which is changeable and set to 1MB currently) then GC is fired (and the counter is obviously reset).
    The basic idea is that there has been significant allocation since the last GC and hence do it again.
  2. Resource allocation failure
    If some internal native allocation fails, like loadlibrary fails or JIT buffer allocation fails due to out-of-memory condition then GC is started to free up some memory and the allocation is re-attempted (only 1 re-attempt)
  3. User code can trigger GC
    Using the managed API System.GC.Collect(), user code can force a GC
  4. Sharing server initiated
    One of the new features in the WP7 CLR is the sharing server (see my post http://blogs.msdn.com/b/abhinaba/archive/2010/04/28/we-believe-in-sharing.aspx for details). In WP7 there is a central server coordinating all the managed processes. If this sharing server is notified of low memory condition, it starts GC in all the managed processes in the system.

The GC is NOT run in the following cases (I am explicitly calling these out because in various conferences and interactions I’ve heard folks thinking it might be)

  1. GC is not run on some timer. So if a process is not allocating any memory and there is no low-memory situation then GC will never be fired irrespective of how long the application is running
  2. The phone is never woken up by the CLR to run GC. GC is always in response to an active request OR allocation failure OR low memory notification.
  3. In the same lines there is no GC thread or background GC on WP7


For folks migrating from NETCF 3.5 the list below gives you the changes

  1. WinForm Application going to background used to fire GC. On WP7 this is no longer true
  2. Sharing server based changes are obviously new
  3. The GC quantum cannot be changed by user

Wednesday, May 12, 2010

Inside the Windows Phone Emulator

US

Learn from the dev lead and PM of Windows Phone 7 Emulator on how it works and delivers the awesome performance.

Some key points

  1. The emulator is essentially a x86 based Virtual Machine running full image of Windows Phone 7 OS
  2. It emulates various peripherals (e.g. audio, networking), the list hopefully will grow in the future
  3. Supports multi-touch if your host PC has a touch screen
  4. It uses the GPU on the host PC to accelerate the graphics
  5. Shameless plug: One of the reason it’s possible to emulate x86 and still have managed apps running as-is, is because the runtime (.NET Compact Framework) supports both x86 and ARM seamlessly (provides JITer for both architectures and runs the same managed code on both seamlessly)

Get Microsoft Silverlight

Wednesday, April 28, 2010

We Believe in Sharing

Good Morning

In Building NETCF for Windows Phone 7 series we put in couple of features to enhance startup performance and ensure that the working set remains small. One of these features added is code/data sharing.

Native applications have inherent sharing where multiple processes can share the same executable code. However, in case of managed code running on NETCF 3.5 even when multiple applications use the same assembly, the managed code in them are JITed in context of each process separately. This results in suboptimal resource utilization because of the following

  1. Repeated JITing of the same code
  2. Memory overhead of having identical copies of the same JITed code for every process running them. The execution engine also maintains records of the various types loaded and even though two (or more) processes may be loading the same types from the same assemblies; per process copies are maintained for them.

Together the overhead can be significant.

In the latest version of the runtime shipping with Windows Phone 7 (.NET Compact Framework 3.7) we added a feature to share both the JITed code and these type information across multiple managed processes.

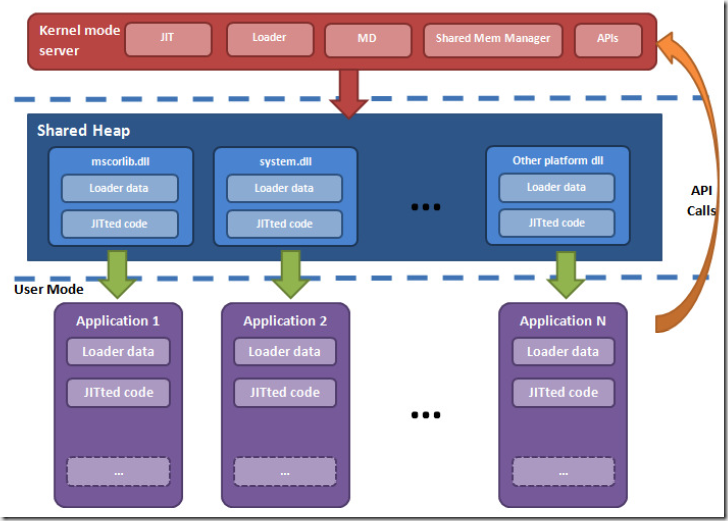
image

The runtime essentially uses a client server architecture. We added a new kernel mode server
which is responsible of maintaining a system wide shared heap. The server on receiving requests
from the various client processes (each managed app is a client) JITs code and type information
into this shared heap. The shared heap is accessed Read-only from all the client apps and
Read/write from the server.

When a process requests for the same type to be loaded or code to be JITed it just re-uses the already loaded type info or JITed code from the shared heap.
What is shared

  1. Various Execution engine data-structures like loader type-information
  2. JITed code from a predefined list of platform assemblies (user code is not shared).

Do note that user code is not shared and neither is all platform code. Sharing arbitrarily would actually increase cost if they ultimately didn’t get reused in a lot of applications. The list of assemblies/data shared was carefully chosen and tuned to ensure only those are shared that provided the maximum performance benefit.

Sharing provides the following advantages

  1. Warm startup time is significantly reduced. When a new application is coming up a large
    percentage of the initial code and type-info is already found on the shared heap and hence
    there is significant perf boost. The exact number depends on the applications but it’s common
    to get around 30% gains
  2. Significant reduction in net working set as a lot of commonly used platform assembly JITed code is re-used
  3. Obviously there are other goodness like less JITing means less processing on the device

Like user code the system is also capable of pitching the shared code when there is a low memory situation on the device.

Wednesday, March 17, 2010

Silverlight on Nokia S60 platform

Bidar - Fort

Today at MIX 2010 we announced Silverlight beta for Nokia S60 phones. Go download the beta from http://silverlight.net/getstarted/devices/symbian/

Currently the supported platform is S60 5th Edition phones and in particular the 5800 XpressMusic, N97 and N97 mini. It works in-browser and only in the Nokia default web-kit based browser.

Silverlight on S60 uses .NET Compact Framework (NETCF) underneath it. I work in the dev team for the Execution Engine of NETCF and I was involved at the very beginning with getting NETCF to work on the S60 platform.

NETCF is extremely portable (more about that in later posts) and hence we didn’t have a lot of trouble getting it onto S60. We abstract away the platform by coding against a generic platform abstraction layer (PAL), but even then we had some challenges. Getting .NET platform on a non-Windows OS is challenging because so much of our code relies on Windows like functionality (semantics) which might not be available directly on other platforms.

As I was digging through emails I found the following screenshot that I had sent out to the team when I just got NETCF to work on the S60 Emulator…

image

As you can see the first code to run was a console application and it was not Hello World :). We have come a long way since then as evident from the touch based casual game running on the N97 shown below

image

MIX 2010 Announcements

Bidar Trip - Mohamad Gawan Madrasa

Today is a very big day for me and my team. The stuff we have been working on is finally went live on stage MIX 2010.

Windows Phone 7 is easily the most dramatic re-entry/reset Microsoft has undertaken in any field it’s in. We announced the phone in MWC and the reception it got was phenomenal. However, in the new connected devices world, the application platform+market story is as or more important than the device itself. Today at MIX we just disclosed details of that.

  1. The application model supported on Windows Phone 7 series will be managed only and will leverage Silverlight, XNA and the .NET Compact Framework. So basically you can reuse your C#/.NET and Silverlight skills to build amazing experience on the phone. I will get into details of this in the coming posts
  2. Microsoft just announced free Windows Phone Developer Tools (preview bits available for download head over to http://developer.windowsphone.com/ )
    1. This builds on the amazing development experience brought in by the Visual Studio 2010 shell.
    2. You can either get a standalone Visual Studio 2010 Express for Windows Phone Or an addin for your previously installed VS 2010
    3. Windows Phone 7 series emulator (yes you do not even need a device to develop for Windows Phone)
  3. A version of Expression Blend is also demonstrated for the Windows Phone (a free version will be available for download in the coming months)
  4. A new Windows Phone Marketplace is being put into place
    1. Developers can earn 70% revenue from the applications they sell of the marketplace
    2. The registration to the market place is not free but it’ll be free for the DreamSpark program for students

Our team was involved with building the IDE, the emulator and the core .NET runtime that powers the applications. So watch out and in the coming posts I’ll deep dive into these areas.

Sunday, December 27, 2009

Back to Basics: Memory leaks in managed systems

Kolkata Trip 2009

Someone contacted me over my blog about his managed application where the working set goes on increasing and ultimately leads to out of memory. In the email at one point he states that he is using .NET and hence there should surely be no leaks. I have also talked with other folks in the past where they think likewise.

However, this is not really true. To get to the bottom of this first we need to understand what the the GC does. Do read up http://blogs.msdn.com/abhinaba/archive/2009/01/20/back-to-basics-why-use-garbage-collection.aspx.

In summary GC keeps track of object usage and collects/removes those that are no longer referenced/used by any other objects. It ensures that it doesn’t leave dangling pointers. You can find how it does this at http://blogs.msdn.com/abhinaba/archive/2009/01/25/back-to-basic-series-on-dynamic-memory-management.aspx

However, there is some catch to the statement above. The GC can only remove objects that are not in use. Unfortunately it’s easy to get into a situation where your code can result in objects never being completely de-referenced.

Example 1: Event Handling (discussed in more detail here).

Consider the following code

EventSink sink = new EventSink();
EventSource src = new EventSource();

src.SomeEvent += sink.EventHandler;
src.DoWork();

sink = null;
// Force collection
GC.Collect();
GC.WaitForPendingFinalizers();

In this example at the point where we are forcing a GC there is no reference to sink (explicitly via sink = null ), however, even then sink will not be collected. The reason is that sink is being used as an event handler and hence src is holding an reference to sink (so that it can callback into sink.EventHandler once the src.SomeEvent is fired) and stopping it from getting collected


Example 2: Mutating objects in collection (discussed here)


There can be even more involved cases. Around 2 years back I saw an issue where objects were being placed inside a Dictionary and later retrieved, used and discarded. Now retrieval was done using the object key. The flow was something like


  1. Create Object and put it in a Dictionary
  2. Later get object using object key
  3. Call some functions on the object
  4. Again get the object by key and remove it

Now the object was not immutable and in using the object in step 3 some fields of that object got modified and the same field was used for calculating the objects hash code (used in overloaded GetHashCode). This meant the Remove call in step 4 didn’t find the object and it remained inside the dictionary. Can you guess why changing a field of an object that is used in GetHashCode fails it from being retrieved from the dictionary? Check out http://blogs.msdn.com/abhinaba/archive/2007/10/18/mutable-objects-and-hashcode.aspx to know why this happens.


There are many more examples where this can happen.


So we can conclude that memory leaks is common in managed memory as well but it typically happens a bit differently where some references are not cleared as they should’ve been and the GC finds these objects referenced by others and does not collect them.

Thursday, December 03, 2009

NETCF: Count your bytes correctly

Pirate

I got a stress related issue reported in which the code tried allocating a 5MB array and do some processing on it but that failed with OOM (Out of Memory). It also stated that there was way more than 5 MB available on the device and surely it’s some bug in the Execution Engine.

Here’s the code.

try{
byte[] result;
long GlobalFileSize = 5242660; //5MB
result = new byte[GlobalFileSize];
string payload = Encoding.UTF8.GetString(result, 0, result.Length);
System.Console.WriteLine("len " + payload.Length);
}
catch (Exception e)
{
System.Console.WriteLine("Exception " + e);
}

The problem is that the user didn’t count his bytes well. The array is 5MB and it actually gets allocated correctly. The problem is with the memory complexity of the UTF8.GetString which allocates further memory based on it’s input. In this particular case the allocation pattern goes something like

  5MB  -- Byte Array allocation (as expected and works)

5MB -- Used by GetString call
10MB -- Used by GetString call
5MB -- Used by GetString call
10MB -- Used by GetString call


So GetString needed a whooping 30MB and the total allocation is around 35MB which was really not available.


Morale of the story: Count your bytes well, preferably through a tool like Remote Performance Monitor

Thursday, September 10, 2009

Global variables are bad

Hyderabad Zoological Park

<This post is about C++ (C# folks are saved from this pain)>

One of our devs taking care of NETCF on Nokia S60 reported that after the latest code reached their branch things are working very slow. It was observed that Garbage Collector is getting kicked in way more than it should. Investigation showed something interesting.

I added a global var gcConfig which had a fairly complex constructor and that among other things sets the various member variables like the GC trigger threshold to default value (1mb). All of these works fine on Windows variants.

However, TCPL states “It is generally best to minimize the use of global variables and in particular to limit the use of global variables requiring complicated initialization.”. This is especially true for dlls. We tend to ignore good advice sometimes :)

For Symbian OS (S60) on device complex ctors of global objects are not run (without any warning). The members are all set to 0 (default member initialization). So in the gcConfig GC-trigger was being set to 0 instead of 1mb. The allocation byte count is compared against this value to figure out when it’s time to start a GC. Since it was 0 the collection condition is being met for every allocation and hence for every allocation request GC was being fired!!!

Actually considering that even after that the app was actually running shows that we have pretty good perf ;)

A good alternative of using global vars is as follows

MyClass& useMC()
{
static MyClass mc; // static ensures objects are not created on each call
return mc;
}

MyClass& mc = useMC();

Do note that this has some multi-threading issue. See http://blogs.msdn.com/oldnewthing/archive/2004/03/08/85901.aspx.

Monday, September 07, 2009

.NET Compact Framework BCL < .NET BCL

Hyderabad Zoological Park

Over twitter some folks are regularly discussing about the fact that there are some chunks of desktop .NET Base class library (BCL) that are missing on the .NET Compact Framework (.NETCF). So I thought I’d post the rationale behind things that are missing and what criteria is used to figure out what makes it in.

First of all, .NET and .NETCF use completely different runtimes. So the BCL code doesn’t work as is. They need to be ported over. Something being available on the desktop reduces the effort of our BCL team but still significant cost is involved in making it work over NETCF. This means that its not as if everything is available on .NETCF BCL and we cut things out (elimination process), but the other way round where we start from 0 and we need to figure out whether we can take something in. In that process we use some of the following rationale.

  1. ROI: Does the user scenario that it enables on a mobile device justify the cost
    System.CodeDom.Compiler. Yea right you expected to compile on the phone didn’t you :)
  2. Easy workaround available: If there is an acceptable workaround for a given API then it drops in priority. A trivial example could be that we ship some method overloads but not the other. E.g. Instead of shipping all overloads of Enum.Parse we drop Enum.Parse(Type, String) and keep only Enum.Parse(Type, String, Bool).
    This applies at the level of namespace or Types as well.
  3. Lower in priority list: It needs work to get it done and it’s lower in priority than other things that is keeping the engineering team busy.
    If there are a lot of request for these features and not good/performant workarounds available then it will go up the priority list and make it to future version of NETCF
  4. Too large to fit: Simply too large to fit into our memory limitations
    E.g. Reflection.Emit which leads to other things missing like Dynamic Language Runtime, Linq-to-SQL
  5. No native support: It uses some underlying OS feature which is either not present on devices or is not relevant to it
    WPF, Parallel computing support

With every release developers ask for new features and we also negotiate to increase NETCF footprint budget so that we can include some (but not all) from those requests. To choose what makes it in we use some of the criteria mentioned above.

Given the system constraints under which NETCF works a vast majority of the desktop APIs will continue to be missing from NETCF. Hopefully this gives you some context behind why those are missing. If you approach NETCF simply from trying to port a desktop application then you would face some frustration on the missing surface area.

BTW: Do post your comments on this blog or on twitter (use the #netcf hashtag).

<Update: I made some updates to this based on feedback />

Tuesday, September 01, 2009

NETCF: GC and thread blocking

Hyderabad Zoological Park

One of our customers asked us a bunch of questions on the NETCF garbage collector that qualifies as FAQ and hence I thought I’d put them up here.

Question: What is the priority of the GC thread
Answer: Unlike some variants of the desktop GC and other virtual machines (e.g. JScript) we do not have any background or timer based GC. The CLR fires GC on the same thread that tried allocation and either the allocation failed or during pre-allocation checks the CLR feels that time to run GC has come. So the priority of the GC thread is same as that of the thread that resulted in GC.

Question: Can the GC freeze managed threads that are of higher priority than the GC thread?
Answer: Yes GC can freeze managed threads which has higher priority than itself. Before actually running GC the CLR tries to go into a “safe point”. Each thread has a suspend event associated with it and this event is checked by each thread regularly. Before starting GC the CLR enumerates all managed threads and in each of them sets this event. In the next point when the thread checks and finds this event set, it blocks waiting for the event to get reset (which happens when GC is complete). This mechanism is agnostic of the relative priority of the various threads.

Question: Does it freeze all threads or only Managed threads?
Answer: The NETCF GC belongs to the category “stop-the-world GC”. It needs to freeze threads so that when it is iterating and compacting managed heap nothing on it gets modified. This is unlike some background/incremental GC supported by other virtual machines.

GC freezes only managed threads and not other native threads (e.g. COM or host-threads). However, there are two exclusions even on the managed threads

  1. It doesn’t freeze the managed thread that started GC because the GC will be run on that thread (see answer to first question)
  2. Managed threads that are currently executing in native p/invoke code is not frozen either. However, the moment they try to return to managed execution they get frozen. (I actually missed this subtle point in my response and Brian caught it :))

Hope this answers some of your questions. Feel free to send me any .NET Compact Framework CLR questions. I will either answer them myself or get someone else to do it for you :)

Sunday, May 31, 2009

How does the .NET Compact Memory allocator work

Aalankrita - Twins

As I mentioned in one of my previous posts the .NET Compact Framework uses 5 separate heaps of which one is dedicated for managed data and is called the managed heap. The .NETCF allocator, allocates pools of data from this managed heap and then sub-allocates managed objects from this pool.

This is how the process goes

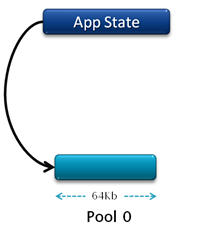
image At the very beginning the allocator allocates a 64Kb pool (called the obj-pool) and ties it with the current app-domain state (AppState).
image All object allocation requests are served from this pool (Pool 0). After each allocation an internal pointer (shown in yellow) is incremented to point to the end of the last allocated object.
image Subsequent allocation is just incrementing this pointer.
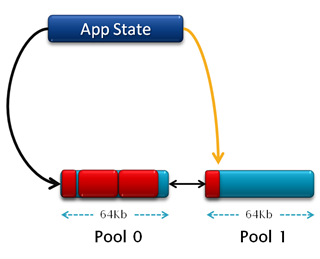
image This goes on until the point where there is no more space left in the current obj-pool
image Since there is no more space left in the current pool (pool 0) a new pool (pool 1) is allocated and all subsequent object allocation requests are serviced from the new pool.

The first question I get asked at this point is what happens when one object itself is bigger than 64Kb :). The answer is that the CLR considers such objects as “huge-objects” and they are placed in their own obj-pool. This essentially means that either obj-pools are 64Kb in size and has more than one object in them or are bigger than 64Kb and has only one huge-object in it.

Object allocation speed varies a lot between whether it is being allocated from the current pool (where it is just the cost of a pointer increment) or it needs a new pool to be allocated (where there is additional cost of a 64Kb allocation). On the average managed objects are 35 bytes in size and around 1800 can fit in one pool and hence on the whole allocation speed attained is pretty good.

Verifying what we discussed above

All of the things I said above can be easily verified using the Remote Performance monitor. I wrote a small application that allocates objects in a loop and launched it under Remote Performance monitor and published the data to perfmon so that I can observe how the managed heap grows. I used the process outlined in Steven Pratschner’s blog post at http://blogs.msdn.com/stevenpr/archive/2006/04/17/577636.aspx 

image

Using the above mentioned mechanism I am observing the managed bytes allocated (green line) and the GC Heap (red line). You can see that the green line increases linearly and after every 64Kb the red line or the GC Heap bumps up by 64Kb as we allocate a new object pool from the heap.

Monday, May 04, 2009

Memory leak via event handlers

Golconda fort - light and sound

One of our customers recently had some interesting out-of-memory issues which I thought I’d share.

The short version

The basic problem was that they had event sinks and sources. The event sinks were disposed correctly. However, in the dispose they missed removing the event sink from the event invoker list of the source. So in effect the disposed sinks were still reachable from the event source which is still in use. So GC did not de-allocate the event sinks and lead to leaked objects.

Now the not-so-long version

Consider the following code where there are EventSource and EventSink objects. EventSource exposes the event SomeEvent which the sink listens to.

EventSink sink = new EventSink();
EventSource src = new EventSource();

src.SomeEvent += sink.EventHandler;
src.DoWork();

sink = null;
// Force collection
GC.Collect();
GC.WaitForPendingFinalizers();

For the above code if you have a finalizer for EventSink and add a breakpoint/Console.WriteLine in it, you’d see that it is never hit even though sink is clearly set to null. The reason is the 3rd line where we added sink to the invoke list of source via the += operator. So even after sink being set to null the original object is still reachable (and hence not garbage) from src.


+= is additive so as the code executes and new sinks are added the older objects still stick around resulting in working set to grow and finally lead to crash at some point.


The fix is to ensure you remove the sink with –= as in

EventSink sink = new EventSink();
EventSource src = new EventSource();
src.SomeEvent += sink.EventHandler;
src.DoWork();
src.SomeEvent -= sink.EventHandler;
sink = null;

The above code is just sample and obviously you shouldn’t do event add removal in a scattered way. Make EventSink implement IDisposable and encapsulate the += –= in ctor/dispose.