Search

Showing posts with label Coding. Show all posts

Tuesday, May 05, 2020

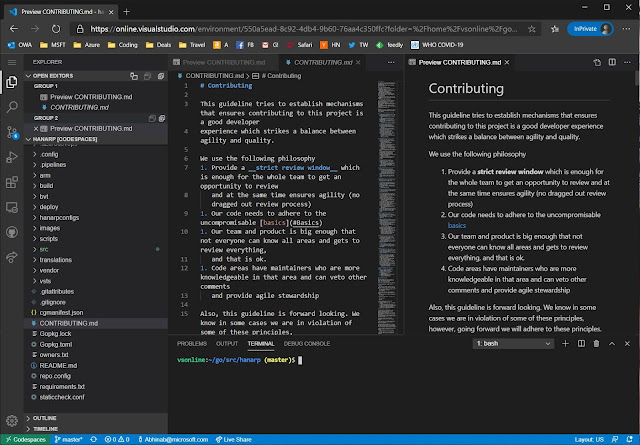
Using Visual Studio Codespaces


One of the pain points we face with remote development is having to go through few extra hops to get to our virtual dev boxes. Many of us uses Azure VMs for development (in addition to local machines) and our security policy is to lock down all VMs to our Microsoft corporate network.

So to ssh or rdp into an Azure VM for development, we first connect over VPN to corporate network, then use a corpnet machine to then login to the VMs. That is painful and more so now when we are working remotely.

This is  where the newly announced Visual Studio Codespaces come in. Basically it is a hosted vscode in the cloud. It runs beautifully inside a browser and best of all comes with full access to the linux shell underneath. Since it is run as a service and secured by the Microsoft team building it, we can simply use it from a browser on any machine (obviously over two-factor authentication).

At the time of writing this post, the cost is around $0.17 per hour for 4 core/8GB which brings the price to around $122 max for the whole month. Codespaces also has a snooze feature. I use snooze after one hour of no usage. This does mean additional startup time when you next login, but saves even more money. In between snooze the state of the box is retained.


While just being able to use the IDE on our code base is cool in itself, having access to the shell underneath is even cooler. Hit Ctrl+` in vscode to bring up the terminal window.


I then sync'd my linux development environment from https://github.com/abhinababasu/share, installed required packages that I need. Finally I have a full shell and IDE in the cloud, just the way I want it.

To try out Codespaces head to https://aka.ms/vso-login

Monday, February 17, 2020

System Engineering Guidelines


While building our system that powers memory intensive compute in Azure we use the following engineering guidelines. We use these guidelines to build our BareMetal resource provider, cluster manager etc. These are useful principles we have accumulated from experience building various systems. What other principles do you use and recommend including?
  1. Close on broad design before sending PRs.
    1. Add design as markdown to root of the feature code path and discuss it as a PR. For broad cross RP feature it is ok to place it in the root
    2. For sizable features please have a design meeting
    3. Requirement for a design meeting is to send a pre-read and expectation is all attendees have reviewed the pre-read before coming in
  2. Be aware of distributed system quirks
    1. Think CAP theorem. This is a distributed system, network partition will occur, be explicit about your availability and consistency model in that event
    2. All remote calls will fail, have re-tries that uses exponential back-off. Log warning on re-tries and error if it finally fails
    3. Ensure we always have consistent state. There should be only 1 authoritative version of truth. Having local data that is eventually consistent with this truth is acceptable. Know the max time-period for eventual consistency
  3. System needs to be reliable, scalable and fault tolerant
    1. Always avoid SPOF (Single Point of Failure), even for absolutely required resources like SQLServer consider retrying (see below), gracefully fail and recover
    2. Have retries
    3. APIs need to be responsive and return in sub second for most scenarios. If something needs to take longer, immediately return with a mechanism to track progress on the background job started
    4. All API and actions we support should have a 99.9 uptime/success SLA. Shoot for 99.95
    5. Our system should be stateless (have state elsewhere in data-store) and designed to be cattle and not pets
    6. Systems should be horizontally scalable. We should be able to simply add more nodes to a cluster to handle more traffic
    7. Choose to use a managed service over attempting to build it or deploy it in-house
  4. Treat configuration as code
    1. Breaks due to out of band config changes are too common. So consider config deployment the same way as code deployment (Use SCD == Safe Config/Code Deployment)
    2. Config should be centralized. Engineers shouldn't be hunting around to look for configs
  5. All features must have feature flag in config.
    1. The feature flag can be used to disable features in per region basis
    2. Once a feature flag is disabled the feature should cause no impact to the system
  6. Try to make sure your system works on a single boxThis makes dev-test significantly easier. Mocking auxiliary systems is OK
  7. Never delete things immediately
    1. Don't delete anything instantaneously, especially data. Tombstone deleted data away from user view
    2. Keep data, metadata, machines around for a garbage collector to periodically delete at configurable duration.
  8. Strive to be event driven
    1. Polling is bad as the primary mechanism
    2. Start with event driven approach and have fallback polling
  9. Have good unit tests.
    1. All functionality needs to ship with tests in the same PR (no test PR later)
    2. Unit test tests functionality of units (e.g. class/modules)
    3. They do not have to test every internal functions. Do not write tests for tests' sake. If test covers all scenarios exposed by an unit, it is OK to push back on comments like "test all methods".
    4. Think what does your unit implement and can the test validate the unit is working after any changes to it
    5. Similarly if you add a reference to an unit from outside and depend on a behavior consider adding a test to the callee so that changes to that unit doesn’t break your requirements
    6. Unit test should never call out from dev box, they should be local tests only
    7. Unit test should not require other things to be spun up (e.g. local SQL server)
  10. Consider adding BVT to scenarios that cannot be tested in unit tests.
    E.g. stored procs need to run against real SqlDB deployed in a container during BVT, or test query routing that needs to run inside a web-server
  11. All required tests should be automatically run and not require humans to remember to run them
  12. Test in production via our INT/canary clusterSomethings simply cannot be tested on dev setup as they rely on real services to be up. For these consider testing in production over our INT infra.
    1. All merges are automatically deployed to our INT cluster
    2. Add runners to INT that simulate customer workloads.
    3. Add real lab devices or fake devices that test as much as possible. E.g. add fake snmp trap generator to test fluentd pipeline, have real blades that can be rebooted using our APIs periodically
    4. Bits are then deployed to Canary clusters where there are real devices being used for internal testing, certification. Bake bits in Canary!
  13. All features should have measurable KPIs and metrics.
    1. You must add metrics against new features. Metrics should tell how well your feature is working, if your feature stops working or if any anomaly is observed
    2. Do not skimp on metrics, we can filter metrics on the backend rather than not having them fired
  14. Copious logging is required.
    1. Process should never fail silently
    2. You must add logs for both success and failure paths. Err on the side of too much logging
  15. Do not rely on text logs to catch production issues.
    1. You cannot rely on too many error logs from a container to catch issues. Have metrics instead (see above)
    2. Logs are a way to root-cause and debug and not catch issues
  16. Consider on-call for all development
    1. Ensure you have metrics and logs
    2. Ensure you write good documentation that anyone in the team can understand without tons of context
    3. Add alerts with direct link to TSGs
    4. Add actionable alerts where the on-call can quickly mitigate
    5. On-call should be able to turn off specific features in case it is causing problems in production
    6. All individual merges can be rolled back. Since you cannot control when code snap for production happens the PRs should be such that it can be individually rolled back

Sunday, January 19, 2020

Chobi - Face Detection Based Static Image Gallery Generator

Over the holidays I created a simple static photo gallery generator that I named chobi. The sources are in https://github.com/abhinababasu/chobi.

Given a source folder of photos, chobi will generate a destination folder containing the original photos, generated thumbnails, css stylesheets, scripts and html files which constitute a website displaying those photos as follows


The Problem

While building chobi and also when I was looking into similar online tools, I kept hitting a major issue and that prompted further work and this post.

You see thumbnail generation from image has a major problem. I needed the gallery generator to create square thumbnails for the image strip shown at the bottom of the page. However, the generated thumbnails would simply be either from the center or some other arbitrary location. This meant that the thumbnails would cut off at weird places.

Consider the following image.

If I create a thumbnail from a tool without knowing where the face is in the image, it will generate something like
Obviously that doesn't work. So using my vanilla generator I got a website with all sorts of similar head chopped off thumbnails (marked in Red)


The Solution

Chobi uses face-detection to ensure that does not happen and the face is always fully present in the generated thumbnail. Consider the same thumbnail as above but now with face-detection

Another example of an original image and then generated thumbnail first without and then with face-detection.


With this face-detection plugged in chobi generates a much better web-site, with almost no photo cropped where it shouldn't be.

Sources

  1. Chobi sources are at https://github.com/abhinababasu/chobi
  2. It uses the face-detected thumbnail generator which I wrote at https://github.com/abhinababasu/facethumbnail
  3. That is in turn is based out of a face detection library pigo written fully in go

Sample

Checkout a gallery build using chobi at 

Monday, January 06, 2020

Chobi - A static photo gallery generator


I love using Microsoft Todo and before taking time off in December I create a holiday todo list. I tend to be at home with the family and do bunch of projects around. I try to ensure that I am not doing only work related projects during that time, so put in a ceiling of half a week for coding related stuff. Other Todos generally involves carpentry, DIY home projects, yardwork, cleaning etc.

One of the projects was to update my online photo gallery. Now being a programmer I made it way more complicated than I should've. I decided to code up a minimalistic program to generate static photogallery out of folders of images I export out of Adobe Lightroom. As I mentioned above one of the requirement was to finish it in around 3 days.

I am happy to share that I have the project done and the sources are available at https://github.com/abhinababasu/chobi. It took me about 3 days and most of the time was spent figuring out UI stuff which I rarely do and pondering about which photos to put in the gallery.

The code is in go and it does the following

  1. It iterates through a folder of images (sub-dir not supported yet) and copies the images to a destination
  2. Also places thumbnails (configurable size) into the destination
  3. There is a template html that it modifies to display those images
  4. It also uses some client side script to 
    1. Randomize the image order
    2. Show a carousel of the images
    3. A thumbnail gallery at the bottom
    4. Automated photo rotation
Here's a screenshot of the sample landscape gallery.


Since this was very time-bound project there are tons to stuff left to do, some basic bugs abound as well. But I decided to timeout on the effort for now and revisit again hopefully in the spring.

Tuesday, October 09, 2018

SAP HANA Large Instances on Azure

image

Over the past year I have been working to light up bare-metal machines on Azure Cloud. These are specialized bare-metal machines that have extremely high amount of RAM and CPU and in this particular case, purpose built to run SAP HANA in-memory database. We call them the HANA Large Instance and they come certified by SAP (see list here).

So why bare-metal? They are huge high performance machines that goes all the way up to 24TB RAM (yup) and 960 CPU threads. They are purpose built for HANA in memory database and have the right CPU/Memory ratio and high performance storage to run demanding OLTP + OLAP workloads. Imagine a bank being able to load every credit card transaction in the past 5 year and be able to do analytics including fraud detection on a new transaction in a few seconds, or track the flow of commodities from the worlds largest warehouses to millions of stores and 100s of millions of customers. These machines come with 99.99% SLA and can be reserved by customers across the world in US-East, US-West, Japan-East, Japan-West, Europe-West, Europe-North, Australia-SouthEast, Australia-East to SAP HANA workloads.

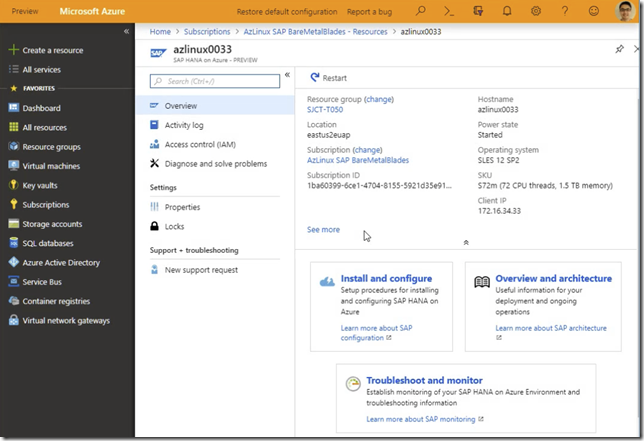
In SAP TechEd and SAPPHIRE I demoed bare-metal HLI machines with standard Azure Portal integration. Right now customers can see their HLI machines in the portal and coming soon even reboot them from the portal.

Portal preview

Click on the screenshot below to see a recorded video on how the Hana Large Instances are visible on the Azure portal and also how customers can raise support requests from the portal.

Portal screenshot

Reboot Demo

This is something we are working on right now and will be available soon. Click on the screenshot below to see the video of a HANA Large instance being rebooted from the portal directly.image

Getting Access

Customers with HLI blades can run the following CLI command to register our HANA Resource Provider

az provider register --namespace Microsoft.HanaOnAzure

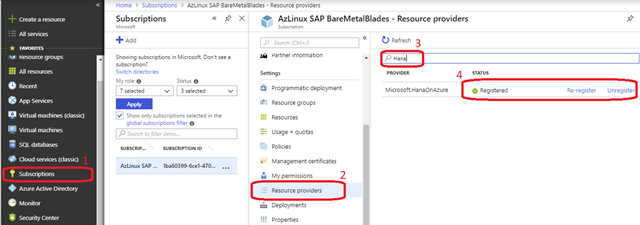
Or alternatively using the http://portal.azure.com. Go to your subscription that has HANA Large Instances, select “Resource Providers”, type “Hana” in the search box. Click on register.

image

Questions?

Send them to sap-hana@microsoft.com

Wednesday, September 13, 2017

Distributed Telemetry at Scale

image

In Designing Azure Metadata Service I elaborated on how we run Azure Instance Metadata Service (IMDS) at massive scale. Running at this scale in 36 regions (at the time of writing) of the world, on incredible number of machines is a hard problem to solve in terms of monitoring and collecting telemetry. Unlike other centralized services it is not as simple as connecting it to a single telemetry pipeline and get done with it.
We need to ensure that
  1. We do not collect too much data (cost/latency)
  2. We do not collect too less (hard to debug issues)
  3. Data collection is fast
  4. We are able to drill down into specific issues and areas of problem
  5. Do all of the above when running in 36 regions of the world
  6. Continue to do all of the above as Azure continues it’s phenomenal growth
To meet all the goals we take a three pronged approach. We break out telemetry to 3 paths
  1. Hot-path: Minimal numeric data that can be uploaded super fast (few second delayed) that we can use for monitoring our service and alert in case anomaly is detected
  2. Warm-path: More richer textual data that are few minute delayed and we can use this to drill down into issues remotely in case hot-path flagged an issue
  3. Cold-path: This gives us full fidelity data to monitor
image

Hot-Path

Even though we run on so many places we want to ensure that we have near real time alerting and monitoring and can quickly catch if something bad is happening. For that we use performance and functionality counters. These counters measure the type of response we are giving back, their latencies, data size etc. All of them are numeric and track each call in progress. We then have high speed uploaders in each machine with backends that can collect these. Then we attach these counters with alerts at per cluster level. We can catch latency issues, failures with few seconds delays. These counters only tell us if something is going bad and not why they are doing so. We have 10s of such numeric high speed telemetry coming from each IMDS instance.
Here’s a snapshot of one such counter in our dashboard showing latency at 90th percentile.
image
In addition we have external dial-tone services that keep pinging IMDS to ensure the services are up everywhere. If there is no response then likely there has been some crash or other deadlocks. We measure the dial-tone as part of our up-time and also have alerts tied to this.
image

Warm-Path

If hot-path counter driven alerts tell us something has gone wrong and an on-call engineer is awaken, the next steps of business is to quickly figure out what’s going on. For that we use our warm-path pipeline. This pipeline uploads informational and error level logging. Due to volume the data is delayed by few minutes. The query granularity can also slow down fetching them. So one of the focus of the hot-path counters is that it can narrow down the location of problem to cluster level/machine level.
The alert directly filters the logs being uploaded to a cluster/machine and brings up all logs. In most cases they are sufficient for us to detect issues. In case that doesn’t work we need to go into the detailed logs.
Cold-Path
Every line of logs (error/info/verbose) our service creates is stored locally on the machines with a certain retention policies. We have built tools so that given an alert an engineer can run a command from his dev box to fetch the log directly from that machine, wherever in the world the machine with the log exists. For hard to debug issues this is the last recourse.
However, more cooler is that we use our CosmosDB offering as a document store and store all error and info logs into that. This ensures the logs remain query-able for a long time (months) for reporting and analysis. We also run jobs that read the logs from these cosmos streams and then shove it into Kusto as structured data. Kusto is also available to users with the more fancier name of Azure Application Insights Analytics. I was floored with the insight we can get with this pipeline. We upload close to 8 terabytes of log data a day into cosmos and still able to query all data over months in a few seconds
Here’s a quick peek into seeing what kind of responses IMDS is handing out.
image
A look into the kinds of queries coming in.
image
Distribution of IMDS version being asked for.
image
We can extract patterns from the logs, run regex matching and all sorts of cool filters and at the same time be able to render data across our fleet in seconds.

Wednesday, May 04, 2016

Customizing Windows Command Shell For Git session

23713373012_50e0f75403_z

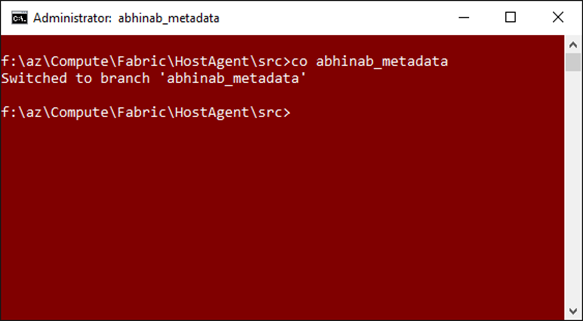
Old habits die hard. From my very first days as developer in .NET and Visual Studio , I am used to have my windows cmd shell title always show the branch I am working on and have a different color for each branch. That way when I have 15 different command window open, I always know which is open where. Unfortunately when I recently moved to GIT, I forgot to customize that and made the mistake of making changes and checking in code into the wrong branch. So I whipped up a simple batch script to fix that.

@ECHO OFF
git checkout %1
for /f "delims=" %%i in ('git rev-parse --abbrev-ref HEAD') do set BRANCH=%%i

@ECHO.
title %BRANCH%

REM Aqua for branch Foo
if "%BRANCH%" == "Foo" color 3F 

REM Red for branch bar
if "%BRANCH%" == "Bar" color 4F

REM Blue
if "%BRANCH%" == "dev" color 1F

I saved the above as co.bat (short for checkout) and now I switch branches using the co <branch-name>.

You can see all the color options by running color /? in your command window.

image

or

image

Tuesday, December 22, 2015

Publishing a ASP.NET 5 Web-Application to IIS Locally


I ran into few issues and discovered some kinks in publishing the new ASP.NET 5 Web-Application to an Internet Information Services (IIS) on the local box and then accessing it from other devices on the same network.

While there may be a number of different ways of doing this, the following worked for me.

Visual Studio

After you have create a new Project using File > New Project > ASP.NET Web Application

image

Change the build to use x64 and not ANY CPU

image

Now Right click on the project and choose publish. We will use File System publishing to push the output to a folder location and then get IIS to load it

image

Publish target is inside default IIS web root folder. This might be different for your setup.

clip_image001

Use 64 bit release in settings
clip_image002

Finally publish it

clip_image003

So with this step done your web application is now published to c:\inetpub\wwwroot\HomeServer

IIS

Now launch the IIS Manager by hitting Win key and searching for IIS Manager

Right click on default web-site and use Add Application.

clip_image001[7]

Create and point the application to the published app. Note that this is not the top level c:\inetpub\wwwroot\HomeServer, but rather the wwwroot folder inside it. This is required because the web.config is inside that folder. So we use c:\inetpub\wwwroot\HomeServer\wwwroot

clip_image002[7]

Hit, OK to create the web-app and then restart the web-site

clip_image003[7]

Now browse to the web-site, which in my case is http://localhost/HomeServer

clip_image004

Accessing from local network

To access the same website from other devices on the same network you need to enable access through the firewall. Search and select (Win key and type) “Allow an App Through Windows Firewall” then in the Control panel window that opens (Control Panel\System and Security\Windows Firewall\Allowed apps), click the “Change Settings” button and then check “World Wide Web Services”

image

Find the local servers IP by running the ipconfig command in command shell. Then you can reach this from other devices on the same network.

Screen shot of accessing the web-site from my cell phone connected to the same network over wifi.

clip_image006

Wednesday, October 21, 2015

How to add a breakpoint in a managed generic method in windbg (sos)

Milkyway over Mt. Rainier

This is not really a blog post but a micro-post. Someone asked me and since I couldn’t find any post out there calling it out, thought I’d add

If you want to add a breakpoint to a managed method inside windbg using sos extension, the obvious way is to use the extension command !bpmd. However, if the target method is generic or inside a generic type it is slightly tricky, you don’t use <T> but rather `<count of generic types>

So I have a the following inside by foo.exe managed app

namespace Abhinaba
{
public class PriorityThreadPool<t> : IDisposable
{
public bool RunTask(T param, Action<t> action)
{
// cool stuff
}
}
}

To set breakpoint in it I use the following (notice the red highlighted part)

!bpmd ApplicationHost.exe Xap.ApplicationHost.PriorityThreadPool`1.RunTask

Tuesday, March 31, 2015

List of Modules loaded

While working on the .NET Loader and now in Bing where I am right now working on some features around module loading I frequently need to know and filter on the list of modules (dll/exe) loaded in a process or on the whole system. There are many ways to do that like use GUI tools like Process Explorer (https://technet.microsoft.com/en-us/sysinternals/bb896653.aspx) or even attach a debugger and get the list of loaded modules. But those to me seems either cumbersome (GUI) or intrusive (debugger). So I have written a small command line tool. It’s native and less than 100kb in size. You can get the source on GitHub at https://github.com/bonggeek/Samples/tree/master/ListModule or the binary at http://1drv.ms/1NAzkvy.

The usage is simple. To see the modules loaded in all processes with the name note in it. You just use the following

F:\GitHub\Samples\ListModule>listmodule note
Searching for note in 150 processes

\Device\HarddiskVolume2\Program Files\Microsoft Office 15\root\office15\ONENOTEM.EXE (8896)
========================================================
(0x00DB0000) C:\Program Files\Microsoft Office 15\root\office15\ONENOTEM.EXE
(0xCBEF0000) C:\windows\SYSTEM32\ntdll.dll
(0x776D0000) C:\windows\SYSTEM32\wow64.dll
...

\Device\HarddiskVolume2\Program Files\Microsoft Office 15\root\office15\onenote.exe (12192)
========================================================
(0x01340000) C:\Program Files\Microsoft Office 15\root\office15\ONENOTE.EXE
(0xCBEF0000) C:\windows\SYSTEM32\ntdll.dll
...

\Device\HarddiskVolume2\Windows\System32\notepad.exe (19680)
========================================================
(0xF64A0000) C:\windows\system32\notepad.exe
(0xCBEF0000) C:\windows\SYSTEM32\ntdll.dll
(0xCB7D0000) C:\windows\system32\KERNEL32.DLL
...


The code uses Win32 APIs to get the info. This is a quick tool I wrote, so if you find any bugs, send it my way.

Wednesday, September 17, 2014

SuppressIldasmAttribute – The Insanity

Meteors and sky Wish Poosh Campground, Cle Elum Lake, WA

We use ildasm in our build deployment pipeline. Recently one internal partner pinged me saying that it was failing with a weird message that ildasm is failing to disassemble one particular assembly. I instantly assumed it to be a race condition (locks taken on the file, some sort of anti-virus holding read locks, etc). However, he reported back it is a persistent problem. I asked for the assembly and tried to run

ildasm foo.dll

I was greeted with


image


Dumbfounded I dug around and found this weird attribute on this assembly

[assembly: SuppressIldasmAttribute] 

MSDN points out http://msdn.microsoft.com/en-us/library/system.runtime.compilerservices.suppressildasmattribute(v=vs.110).aspx that this attribute is to make ildasm not disassembly a given assembly. For the life of me I cannot fathom why someone invented this attribute. This is one of those things which is so surreal…. Obviously you can simply point reflector or any of the gazillion other disassemblers to this assembly and they be happy to oblige. False sense of security is worse than lack of security, I’d recommend not to use this attribute.

Thursday, December 26, 2013

Getting Arduino Uno work on Windows 8

I keep needing to do this and I couldn’t find one place where all the instructions are placed, so capturing it here. Also the standard instructions at http://arduino.cc/en/Guide/Windows didn’t work for me.

Get the Software

  1. Get Arduino Software from http://arduino.cc/en/Main/Software. Choose the Windows (ZIP file) and unzip it to local PC. I used D:\Skydrive\bin\arduino-1.0.5

Disable Driver Signature Enforcement

Unfortunately this step does disable a security feature of the OS, but I couldn’t find a way to do this otherwise.

  1. Open an command prompt and run the command
    shutdown.exe /r /o /f /t 00
  2. System restarts with Choose an option screen
  3. Select Troubleshoot
  4. Select Advanced options
  5. Select Windows Startup Settings
  6. Click Restart and it will restart into the Advanced Boot Options Screen
  7. Press the keyboard button for the number for Disable Driver Signature Enforcement (which was 7 in my case)
  8. System will restart with driver signature enforcement disabled.

Install The Driver

Press Windows key + W and type “Devices and Printers” and open that. Connect the Arduino board over USB. You should see something called Unknown Device shown in it.

image

Run the installer "D:\Skydrive\bin\arduino-1.0.5\drivers\dpinst-amd64.exe” or locate corresponding path from your installation folder. The window above should get updated as below.

image

You can also verify by again hitting Windows Key + W and typing Device Manager and launching it. Then expand to see the following

image