Search

Tuesday, June 16, 2020

Raspberry Pi Photo frame


This small project brings together bunch of my hobbies together. I got to play with carpentry, photography and software/technology including face detection.

I have run out of places in the home to hang photo frames and as a way around I was planning to get a digital photo frame. When I upgraded my home desktop to 2 x 4K monitors I had my old dell 28" 1080p monitor lying around. I used that and a raspberry pi to create a photo frame. It boasts of the following features
  1. A real handmade frame
  2. 1080p display
  3. Auto sync from OneDrive
  4. Remotely managed
  5. Face detection based image crop
  6. Low cost (uses raspberry pi)
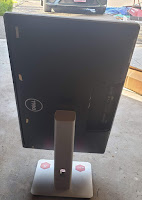
This is how it looks.


Construction

In my previous project of smart-mirror, I focused way too much on the framing monitor part and finally had the problem that the raspberry-pi and the monitor is so well contained inside the frame that I have a hard time accessing it and replacing stuff. So this time my plan was to build a simple lightweight frame that is put on the monitor using velcro fasteners so that I can easily remove the frame. The monitor is actually on its own base, so the frame is just cosmetic and doesn't bear the load of the monitor. Rather the monitor and its base holds the frame in place.

I bought a 2" trim from Homedepot and cut out 4 pieces using a saw and then joined them using just wood glue. To let the glue cure, I held the corners using corner clamp for 12 hours. The glue is actually stronger than the trim itself, so once it dries there is no chance of things falling apart.


On the back of the frame I attached a small piece of wood, on which I added velcro. I also glued velcro to the top of the monitor. These two strips of velcro keeps the frame on the monitor.


Now the frame can be attached loosely to the monitor just by placing on it.

After that I got a raspberry-pi and connected it to the monitor using hdmi cable and attached the raspberry pi with zip ties to the frame. All low tech till this point.
On powering up, it boots into Raspbian.

Software

Base Setup

I always get my base setup 

sudo apt-get update
sudo apt-get upgrade
sudo apt-get install xrdp # install remote desktop
sudo apt-get install vim  # my editor of choice
sudo apt-get install git

git clone https://github.com/abhinababasu/share # get my shell
cp share/.vimrc .
cp share/.bash_aliases .
cp share/.bashrc .
cp share/.bash_aliases .

sudo apt-get install unclutter # hide mouse pointer in slide show

To keep things fresh, reboot midnight every day, add the following to /etc/crontab
0  0    * * *   root    reboot

Enable ssh
sudo raspi-config

Portrait mode
1. sudo vim /boot/config.txt
2. Add the line: display_rotate=3

Push Pics

I use FrameMaker for managing photos I take. My workflow for this case is as follows

  1. All images are tagged with keyword "frame" in lightroom. 
  2. I use smart folder to see all these images and then publish to a folder named Frame in  OneDrive

Sync OneDrive to Raspberry Pi

I used the steps in https://jarrodstech.net/how-to-raspberry-pi-onedrive-sync/ 
  1. curl -L https://raw.github.com/pageauc/rclone4pi/master/rclone-install.sh | bash
  2. rclone config
    1. Enter n (for a new connection) and then press enter
    2. Enter a name for the connection (i’ll enter onedrive) and press enter
    3. Enter the number for One Drive
    4. Press Enter for client ID
    5. Press Enter for Client Secret
    6. Press n and enter for edit advanced config
    7. Enter y for auto config
    8. A browser window will now open, log in with your Microsoft Account and select yes to allow OneDrive
    9. Choose right option for OneDrive personal
    10. Now select the OneDrive you would like to use, you will probably only have one OneDrive linked to your account. This will be 0
    11. Y for subsequent questions
  3. To Sync once: rclone sync -v onedrive:Frame /home/pi/frame
  4. Setup automatic sync every one hour
    1. echo "rclone sync -v onedrive:Frame /home/pi/frame" > ~/sync.sh
    2. chmod +x ~/sync.sh
    3. crontab -e
    4. Add the line: 1 * * * * /home/pi/sync.sh

Setup Screensaver

There are many options that I could find online to show the photos. But I chose to go with the easiest one, use the xscreensaver. However, there are some issues and most likely this is something I will revisit.

  1. Disable screen blanking after some time of no use
    1. vi /etc/lightdm/lightdm.conf
    2. Addd the line[SeatDefaults]
      xserver-command=X -s 0 -dpms

  2. Enable auto-login, so that on restart you directly get logged in and then into screensaver
    1. sudo raspi-config
    2. Select 'Boot Options' then 'Desktop / CLI' then 'Desktop Autologin'. Then right arrow twice and Finish and reboot.

  3.  Setup screen saver
    1. sudo apt-get -y install xscreensaver
    2. sudo apt-get -y install xscreensaver-gl-extra

These are my screen saver settings to show the photos in /home/pi/frame as slideshow


Problems and solving with Face Detection

My photos are rarely 9:16 portraits, that means an ugly black box on the top and bottom of the images. 


Obvious approach is to crop using some batch tool. But that would mean the crop could arbitrarily cut images out. Consider the following image 
Cropping in a batch tool that picks up arbitrary area of the image generated something like below, which is obviously not acceptable.
To solve this I build a tool at https://github.com/abhinababasu/img. It takes my other project on detecting faces in images and then ensures that in the cropped image the face is retained. E.g. the tool above generates the following image.

Monday, June 15, 2020

Building Azure Monitor for SAP Solutions

The Product

Update: Here is a quick-start video
    

This post is about how we build the Azure Monitor for Sap Solutions. It is about the distributed systems we use to build database monitoring at scale for customer's data-plane. However, the first section provides a quick intro into the product itself.

"Azure Monitor for SAP Solutions" provides managed monitoring for the databases powering customer's SAP landscapes. Our monitoring supports multiple instances of databases of a particular type (e.g. HANA) and is also extendable for various kinds of databases. We have started with HANA and plan to include SQL-Server, etc. in the future. At the time of writing this post the monitoring is in  private-preview with public preview coming up "soon".

The customer uses a creation wizard on Azure portal to create the monitor as shown is the screenshot below. Customer enters their subscription, resource group, vnet details, followed by connection details of the database. Our resource provider deploys a VM payload into their vnet that connects with the database to monitor them and pumps telemetry into their Azure analytics workspace. Customers can then create dashboards and configure alerts.

Some example visualization using Workbooks on the Log Analytics Workspace to which we pump the data are as follows. We are still tweaking these and once we are in public preview I plan to come back and edit this post with links to public docs.

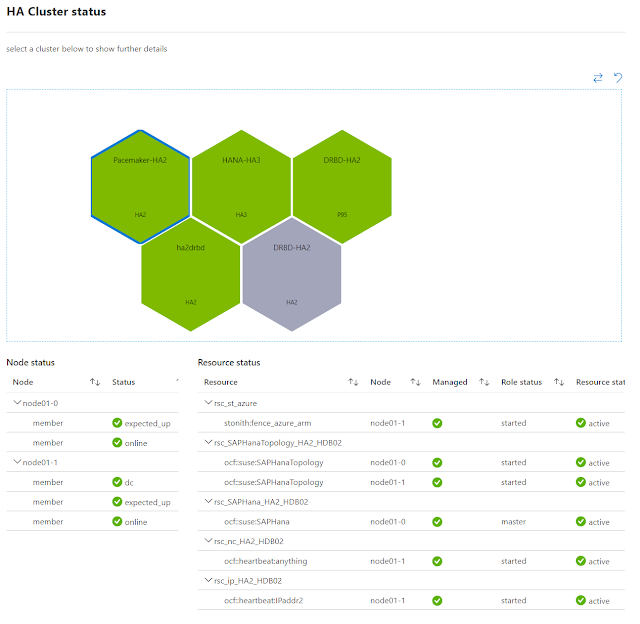
In the screenshot below the visualization shows all database clusters of our test cluster at the same place. Selecting any cluster further drills down into each DB node health.

Similarly in the following visualization we see a cluster is unhealthy and then on drilling down a node is yellow (warning state) because it is triggering our high CPU usage threshold (>50%).

Architecture 

Our product is built on Kubernetes (or rather Azure Kubernetes Service), helm, linkerd, go-lang, fluentd and similar open source software. We use the engineering principles outlined here. Also we stand on the shoulder of giants, we did not have to build many core functionality because it comes for free inside the Azure engineering umbrella. We simply onboard to internal services that provide RBAC, cross region load balancing, billing etc.

If the architecture seems familiar it is because a large part of it is shared with how we manage BareMetal blades running in memory databases (HANA) in Azure and I have posted about that here.

At the high level our architecture looks as follows.

The user/customer interacts with out system using either the Azure Portal (screenshot above), the command line tools or the SDK. We build extensions to the Azure portal for our product sub-area. All resources in azure is exposed using standardized RESTful APIs. The swagger spec is published here and the CLI and SDK is generated out of those.

All interactions of the customer is handled first by the central Azure Resource Manager (ARM). It handles authentication and RBAC. Every resource type in Azure is handled by a corresponding resource provider. In this particular case the resource is Microsoft.HanaOnAzure/sapMonitors and it is handled by the HANA-RP (also referred to as just RP for simplification in this post). ARM knows to forward calls that it gets from customers to a particular regional instance of HANA-RP after taking care of authentication and other gate keeper activities.

The regional Resource Provider or RP

For every Azure region we support we have a HANA-RP (resource provider or RP) instance deployed in that region. The RP is a collection of services that runs on Azure Kubernetes Service (AKS). HANA-RP is build mostly using go-lang and engineered through Azure DevOps. We have automated build pipeline for the RP and single click (maybe a few clicks) deployment. We use use Helm for management.

The service itself is stateless and the state is stored externally in Azure SQL Server. We use both structured data and document-DB style data. All data is replicated remotely to one more region, we configure automated backups for disaster recovery scenarios.

We do not share any state across the RP instances. This provides an important attribute we look for in Azure services, regional isolation. This ensures that in case there is a regional Azure outage it does not effect any other regions.

Each instance of RP manages all monitors in its region. When the user uses the CLI/Portal to create the monitor all the details flow over encrypted channel from the ARM into the RP. The RP then deploys the monitoring payload into customers vnet.

All data flow across pods (intra service) and across the services are encrypted in transit and the data that we store is SQL Server is also encrypted at rest. We do not store any customer secrets on our systems (more below).

Tech usage: AKS, Kubernetes, linkerd, nginx, helm, linux, Docker, go-lang, Python, SQL Server, Azure DevOps, Azure Container Repository, Azure Key-vault, etc.

Deployment

Once the RP gets a request to provision a monitor, it talks to other Azure resource providers like Compute, Storage, Security, Networking to setup the monitoring payload inside the customers vnet
  1. The RP creates various networking components (NSG, NIC)
  2. Creates storage account, storage queues
  3. Uses KeyVault to deploy DB access secrets. These are not stored by us, they remain encrypted in transit and in rest inside customer owned KeyVault
  4. Creates log-analytics workspace
  5. Creates collector VM in the resource group (a VM of type B2ms
  6. The VM uses custom script extension to bootstrap docker and pulls down the monitoring payload docker image

The Payload

Since the payload runs inside the customers vnet, we want to be absolutely transparent about what runs inside it. The entire payload is open source and can be accessed at https://github.com/Azure/AzureMonitorForSAPSolutions. Specifically at https://github.com/Azure/AzureMonitorForSAPSolutions/tree/master/sapmon/payload.

The commands use to install, launch and manage individual sub-monitors is in sapmon.py. Specific payloads are in say saphana.py or other files in that folder.

Our payload VM fetches the docker image built out of these sources from our Azure container repository from the following location
 mcr.microsoft.com/oss/azure/azure-monitor-for-sap-solutions
Once this payload starts running inside the payload-VM, it fetches database connectivity information from customer's key-vault where the RP has placed that information. It then starts querying the database to fetch various monitoring information and pumping it into the Azure telemetry pipeline. 

If the customer had opted-in during the monitor creation, the monitor also sends non identifiable telemetry back to Microsoft, so that we can ensure that the monitoring keeps functioning.

We intentionally chose a design where the monitor does not run on the database machine itself and it is isolated in a separate VM. This ensures it is easy to observe the execution of the monitor and it is easy to isolate any impact it may have on the production system of the customer.

The way our monitoring is designed (execute monitoring queries against the database to fetch monitoring information) allows it to monitor any database that is reachable from inside the customers vnet. This includes obviously databases deployed on VMs inside the vnet. In addition it can monitor customer's HANA Large Instances that are running in BareMetal blades in VLANs that are accessible over express-route. Essentially as long as the database server name is resolvable and the database on it is reachable, the monitoring system works.

Scalability

Our HANA-RP is automatically sharded by regions as it only handles all monitors in it's own region. Our stateless micro-services in each of those regions ensures we can easily horizontally scale to handle more control plane calls on the monitor in that region (create/delete monitors).

For the data-plane we actually deploy the entire payload in separate payload VMs inside the customer subscription/resource-group. So each new monitor comes with its own payload VM that monitors a DB (or a few instances of DB) for a given customer resulting in automatically scaling. The data also gets pumped into customer specific analytic workspaces and hence is not a bottleneck.