
The Product
Update: Here is a quick-start videoThis post is about how we build the Azure Monitor for Sap Solutions. It is about the distributed systems we use to build database monitoring at scale for customer's data-plane. However, the first section provides a quick intro into the product itself.
"Azure Monitor for SAP Solutions" provides managed monitoring for the databases powering customer's SAP landscapes. Our monitoring supports multiple instances of databases of a particular type (e.g. HANA) and is also extendable for various kinds of databases. We have started with HANA and plan to include SQL-Server, etc. in the future. At the time of writing this post the monitoring is in private-preview with public preview coming up "soon".
"Azure Monitor for SAP Solutions" provides managed monitoring for the databases powering customer's SAP landscapes. Our monitoring supports multiple instances of databases of a particular type (e.g. HANA) and is also extendable for various kinds of databases. We have started with HANA and plan to include SQL-Server, etc. in the future. At the time of writing this post the monitoring is in private-preview with public preview coming up "soon".
The customer uses a creation wizard on Azure portal to create the monitor as shown is the screenshot below. Customer enters their subscription, resource group, vnet details, followed by connection details of the database. Our resource provider deploys a VM payload into their vnet that connects with the database to monitor them and pumps telemetry into their Azure analytics workspace. Customers can then create dashboards and configure alerts.

Some example visualization using Workbooks on the Log Analytics Workspace to which we pump the data are as follows. We are still tweaking these and once we are in public preview I plan to come back and edit this post with links to public docs.
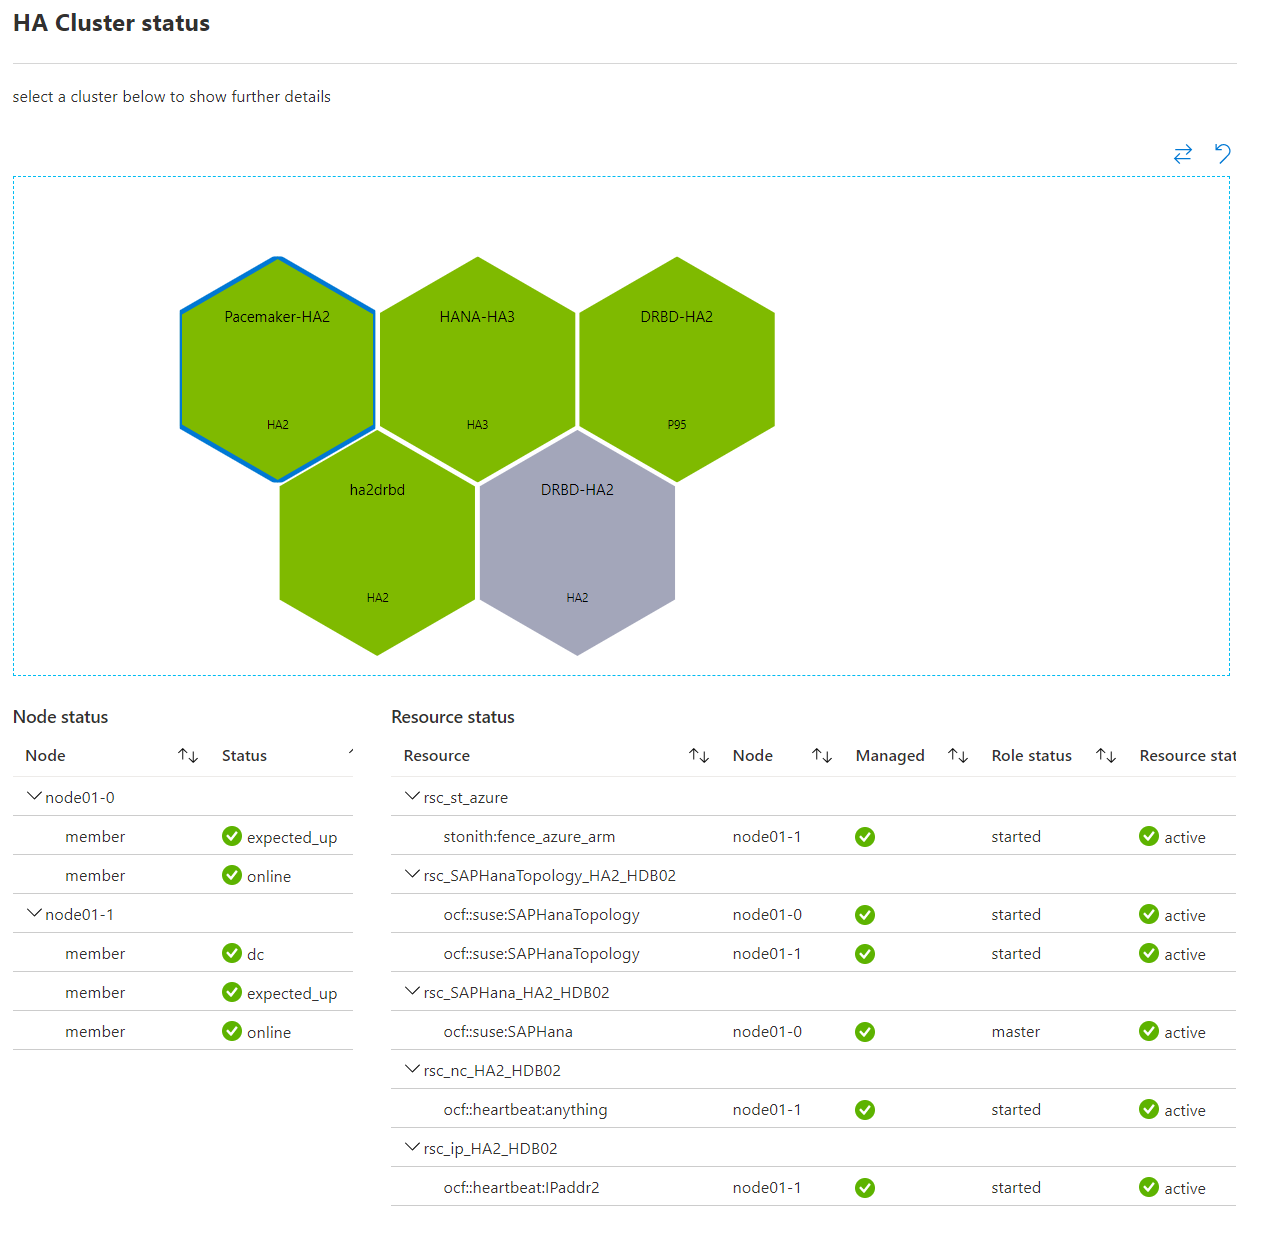
In the screenshot below the visualization shows all database clusters of our test cluster at the same place. Selecting any cluster further drills down into each DB node health.
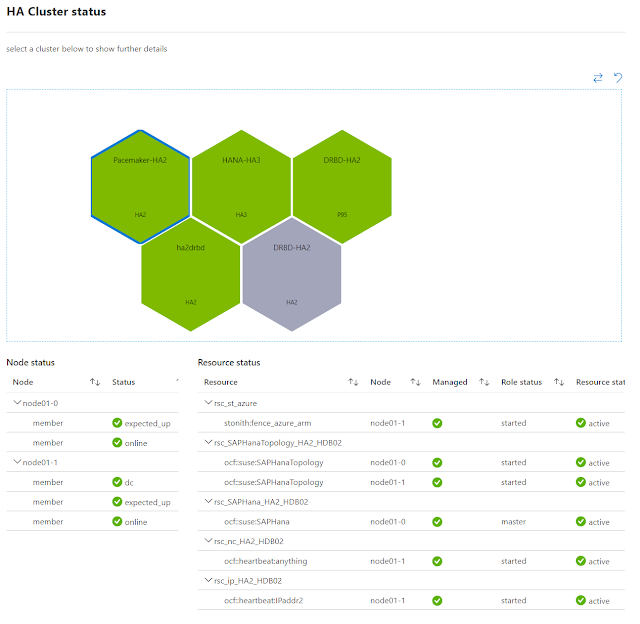
Similarly in the following visualization we see a cluster is unhealthy and then on drilling down a node is yellow (warning state) because it is triggering our high CPU usage threshold (>50%).

In the screenshot below the visualization shows all database clusters of our test cluster at the same place. Selecting any cluster further drills down into each DB node health.
Similarly in the following visualization we see a cluster is unhealthy and then on drilling down a node is yellow (warning state) because it is triggering our high CPU usage threshold (>50%).

Architecture
Our product is built on Kubernetes (or rather Azure Kubernetes Service), helm, linkerd, go-lang, fluentd and similar open source software. We use the engineering principles outlined here. Also we stand on the shoulder of giants, we did not have to build many core functionality because it comes for free inside the Azure engineering umbrella. We simply onboard to internal services that provide RBAC, cross region load balancing, billing etc.
If the architecture seems familiar it is because a large part of it is shared with how we manage BareMetal blades running in memory databases (HANA) in Azure and I have posted about that here.
If the architecture seems familiar it is because a large part of it is shared with how we manage BareMetal blades running in memory databases (HANA) in Azure and I have posted about that here.
At the high level our architecture looks as follows.


The user/customer interacts with out system using either the Azure Portal (screenshot above), the command line tools or the SDK. We build extensions to the Azure portal for our product sub-area. All resources in azure is exposed using standardized RESTful APIs. The swagger spec is published here and the CLI and SDK is generated out of those.
All interactions of the customer is handled first by the central Azure Resource Manager (ARM). It handles authentication and RBAC. Every resource type in Azure is handled by a corresponding resource provider. In this particular case the resource is Microsoft.HanaOnAzure/sapMonitors and it is handled by the HANA-RP (also referred to as just RP for simplification in this post). ARM knows to forward calls that it gets from customers to a particular regional instance of HANA-RP after taking care of authentication and other gate keeper activities.
The regional Resource Provider or RP
For every Azure region we support we have a HANA-RP (resource provider or RP) instance deployed in that region. The RP is a collection of services that runs on Azure Kubernetes Service (AKS). HANA-RP is build mostly using go-lang and engineered through Azure DevOps. We have automated build pipeline for the RP and single click (maybe a few clicks) deployment. We use use Helm for management.
The service itself is stateless and the state is stored externally in Azure SQL Server. We use both structured data and document-DB style data. All data is replicated remotely to one more region, we configure automated backups for disaster recovery scenarios.
We do not share any state across the RP instances. This provides an important attribute we look for in Azure services, regional isolation. This ensures that in case there is a regional Azure outage it does not effect any other regions.
Each instance of RP manages all monitors in its region. When the user uses the CLI/Portal to create the monitor all the details flow over encrypted channel from the ARM into the RP. The RP then deploys the monitoring payload into customers vnet.
Tech usage: AKS, Kubernetes, linkerd, nginx, helm, linux, Docker, go-lang, Python, SQL Server, Azure DevOps, Azure Container Repository, Azure Key-vault, etc.
Deployment
Once the RP gets a request to provision a monitor, it talks to other Azure resource providers like Compute, Storage, Security, Networking to setup the monitoring payload inside the customers vnet
- The RP creates various networking components (NSG, NIC)
- Creates storage account, storage queues
- Uses KeyVault to deploy DB access secrets. These are not stored by us, they remain encrypted in transit and in rest inside customer owned KeyVault
- Creates log-analytics workspace
- Creates collector VM in the resource group (a VM of type B2ms)
- The VM uses custom script extension to bootstrap docker and pulls down the monitoring payload docker image
The Payload
Since the payload runs inside the customers vnet, we want to be absolutely transparent about what runs inside it. The entire payload is open source and can be accessed at https://github.com/Azure/AzureMonitorForSAPSolutions. Specifically at https://github.com/Azure/AzureMonitorForSAPSolutions/tree/master/sapmon/payload.
The commands use to install, launch and manage individual sub-monitors is in sapmon.py. Specific payloads are in say saphana.py or other files in that folder.
Our payload VM fetches the docker image built out of these sources from our Azure container repository from the following location
mcr.microsoft.com/oss/azure/azure-monitor-for-sap-solutions
Once this payload starts running inside the payload-VM, it fetches database connectivity information from customer's key-vault where the RP has placed that information. It then starts querying the database to fetch various monitoring information and pumping it into the Azure telemetry pipeline.
If the customer had opted-in during the monitor creation, the monitor also sends non identifiable telemetry back to Microsoft, so that we can ensure that the monitoring keeps functioning.
We intentionally chose a design where the monitor does not run on the database machine itself and it is isolated in a separate VM. This ensures it is easy to observe the execution of the monitor and it is easy to isolate any impact it may have on the production system of the customer.
The way our monitoring is designed (execute monitoring queries against the database to fetch monitoring information) allows it to monitor any database that is reachable from inside the customers vnet. This includes obviously databases deployed on VMs inside the vnet. In addition it can monitor customer's HANA Large Instances that are running in BareMetal blades in VLANs that are accessible over express-route. Essentially as long as the database server name is resolvable and the database on it is reachable, the monitoring system works.
Scalability
Our HANA-RP is automatically sharded by regions as it only handles all monitors in it's own region. Our stateless micro-services in each of those regions ensures we can easily horizontally scale to handle more control plane calls on the monitor in that region (create/delete monitors).
For the data-plane we actually deploy the entire payload in separate payload VMs inside the customer subscription/resource-group. So each new monitor comes with its own payload VM that monitors a DB (or a few instances of DB) for a given customer resulting in automatically scaling. The data also gets pumped into customer specific analytic workspaces and hence is not a bottleneck.
No comments:
Post a Comment