Search

Monday, November 28, 2022

Wordament Solver


Many many years back in an interview I was asked to design a solver for the game Wordament. At that time I had no idea what the game was and the interviewer patiently explained it to me. I later learnt that couple of engineers in Microsoft came up with the game for the Windows phone platform and it was such a success that they went and bootstrapped a team and made that game their full time job. 

I was able to give a solution in the interview, but that always remained at the back of my mind. I wanted to go further than the theoretical solution and  really build the solver. I began tinkering with the idea a couple of weeks back and over the Thanksgiving long weekend I got enough time to sit down and complete the solution.

You can see it in action at bonggeek.com/wordament/


Basic Idea

We begin by loading dictionary into a Trie data-structure.  Obviously there are fantastic Trie implementation out there, including ones that are highly optimized in memory by being able to collapse multiple nodes into one, however, the whole idea of this exercise was to write some code. So I rolled out a basic Trie.

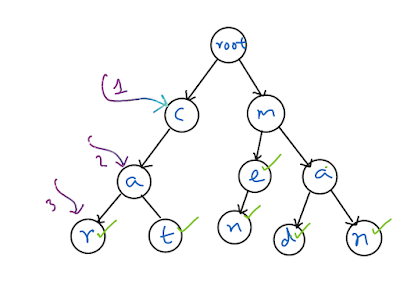
If a particular Trie node is a end of word, then that node is marked as so. As an example a Trie created with the words, cat, car, men, man, mad will look as below. The green checks denote these are valid end of word nodes.


Now starting from each cell of Wordament, we start at the node for that cell character in the Trie. We look at the 8 adjacent cells (neighbors) and if there are Trie children with the same character as the neighbor, then it is a candidate to look into. And we recursively move to that node. At any point if we arrive at a valid word node, then we check to see if that word was previously found, if not, we add the word and the list of cells that created that word in the result.

Finally since Wordament gives higher score for longer words, we sort the list of words by their length.

The logic of this solution is implemented in wordament.go.

I built the solver into a web-service, that runs in a docker container inside Azure VM. The service exposes an API. Then I built a single page web-application, that calls this web-service and renders the solution.

You can hit the API directly with something like
curl -s commonvm1.westus2.cloudapp.azure.com:8090/?input=SPAVURNYGERSMSBE | jq .

The input is all the 16 characters of the Wordament to be solved.

Wednesday, March 02, 2022

CAYL - Code as you like day


Building an enterprise grade distributed service is like trying to fix and improve a car while driving it at high speed down the free-way. Engineering debt accumulates fast and engineers in the team yearn for the time to get to them. A common complaint is also that we need more time to tinker with cool features and tech to learn and experiment.

An approach many companies take is the big hackathon events. Even though they have their place, I think those are mostly for PR and getting eye candy. Which exec doesn’t want to show the world their company creates AI powered blockchain running on quantum computer in just a 3 day hackathon.

This is where CAYL comes in. CAYL or “Code As You Like” is named loosely on “go as you like” event I experienced as a student in India. In a lot of uniform based schools in Kolkata, it is common to have a go as you like day, where kids dress up however they want.

Even though we call it code as you like, it has evolved beyond coding. One of our extended Program Management team has also picked this up and call it the WAYL (Work as you like day). This is what we have set aside in our group calendar for this event.


“code as you like day” is a reserved date every month (first Monday of the month) where we get to code/document or learn something on our own.
There will be no scheduled work items and no standups.
We simply do stuff we want to do. Examples include but not limited to
  1. Solve a pet peeve (e.g. fix a bug that is not scheduled but you really want to get done)
  2. A cool feature
  3. Learn something related to the project that you always wanted to figure out (how do we use fluentd to process events, what is helm)
  4. Learn something technical (how does go channels work, go assembly code)
  5. Shadow someone from a sibling team and learn what they are working on
We can stay late and get things done (you totally do not have to do that) and there will be pizza or ice-cream.
One requirement is that you *have* to present the next day, whatever you did.  5 minutes each

I would say we have had great success with it. We have had CAYL projects all over the spectrum
  1. Speed up build system and just make building easier
  2. ML Vision device that can tell you which bin trash needs to go in (e.g. if it is compostable)
  3. Better BVT system and cross porting it to work on our Macs
  4. Pet peeves like make function naming more uniform, remove TODO from code, spelling/grammar  etc.
  5. Better logging and error handling
  6. Fix SQL resiliency issues
  7. Move some of our older custom management VMs move to AKS
  8. Bring in gomock, go vet, static checking
  9. 3D game where mommy penguin gets fish for her babies and learns to be optimal using machine learning
  10. Experiment with Prometheus
  11. A dev spent a day shadowing dev from another team to learn the cool tech they are using etc.
We just finished our CAYL yesterday and one of my CAYL items was to write a blog about it. So it’s fitting that I am hitting publish on this blog, as I sit in the CAYL presentation while eating Kale chips

Monday, February 07, 2022

Go Generics


Every month in our team we do a Code as You Like Day, which is basically a day of taking time off regular work and hacking something up, learning something new or even fixing some pet-peeves in the system. This month I chose to learn about go-lang generics.

I started go many years back while coming from mainly coding in C++ and C#. Also in Adobe almost 20 years back I got a week long class on generic programming from Alexander Stepanov himself. I missed generics terribly and hated all the code I had hand role out for custom container types. So I was looking forward to generics in go.

This was also the first time I was trying to use a non-stable version of go as generics is available currently as go 1.18 Beta 2. Installing this was a bit confusing for me.

I just attempted go install which seemed to work


but seemed like it did not work. I had to do an additional step of download. That wasn't very intuitive.

For my quick test, I decided to do a port my quick and dirty stack implementation from relying on interface{} to use generic type.

I created a Stack with generic type T which is implemented over a slice of T.

var Full = errors.New("Full")
var Empty = errors.New("Empty")

type Stack[T any] struct {
    arr  []T
    curr int
    max  int
}

Creating two functions to create a fixed size stack or growable was a breeze. Using the generic types was intuitive.

func NewSizedStack[T any] (size int) *Stack[T] {
    s := &Stack[T]{max: size}

    s.arr = make([]T, size)
    return s
}

func NewStack[T any]() *Stack[T] {
    return &Stack[T]{
        max: math.MaxInt32,
    }
}


However, I did fumble on creating the methods on that type. Because I somehow felt I need to write it as func (s *Stack[T])Length[T any]() int {}. However, the [T any] is actually not required.

func (s *Stack[T]) Length() int {
    return s.curr
}

func (s *Stack[T]) IsEmpty() bool {
    return s.Length() == 0
}


Push and Pop worked out as well

func (s *Stack[T]) Push(v T) error {
    if s.curr == len(s.arr) {
        if s.curr == s.max {
            return Full
        } else {
            s.arr = append(s.arr, v)
        }
    } else {
        s.arr[s.curr] = v
    }

    s.curr++

    return nil
}

func (s *Stack[T]) Pop() (T, error) {
    var noop T // 0 value
    if s.Length() == 0 {
        return noop, Empty
    }

    v := s.arr[s.curr-1]
    s.arr[s.curr-1] = noop // release the reference
    s.curr--

    return v, nil
}
However, for pop I needed to return a nil/0-value for the generic type. It did seem odd that go does not implement something specific for it. I had to create a variable as noop and they return that.

Using the generic type is a breeze too, no more type casting!
s := NewStack[int]()

s.Push(5)
if v, e := s.Pop(); e != nil {
    t.Errorf("Should get poped value")
}

Tuesday, June 16, 2020

Raspberry Pi Photo frame


This small project brings together bunch of my hobbies together. I got to play with carpentry, photography and software/technology including face detection.

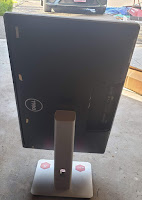
I have run out of places in the home to hang photo frames and as a way around I was planning to get a digital photo frame. When I upgraded my home desktop to 2 x 4K monitors I had my old dell 28" 1080p monitor lying around. I used that and a raspberry pi to create a photo frame. It boasts of the following features
  1. A real handmade frame
  2. 1080p display
  3. Auto sync from OneDrive
  4. Remotely managed
  5. Face detection based image crop
  6. Low cost (uses raspberry pi)
This is how it looks.


Construction

In my previous project of smart-mirror, I focused way too much on the framing monitor part and finally had the problem that the raspberry-pi and the monitor is so well contained inside the frame that I have a hard time accessing it and replacing stuff. So this time my plan was to build a simple lightweight frame that is put on the monitor using velcro fasteners so that I can easily remove the frame. The monitor is actually on its own base, so the frame is just cosmetic and doesn't bear the load of the monitor. Rather the monitor and its base holds the frame in place.

I bought a 2" trim from Homedepot and cut out 4 pieces using a saw and then joined them using just wood glue. To let the glue cure, I held the corners using corner clamp for 12 hours. The glue is actually stronger than the trim itself, so once it dries there is no chance of things falling apart.


On the back of the frame I attached a small piece of wood, on which I added velcro. I also glued velcro to the top of the monitor. These two strips of velcro keeps the frame on the monitor.


Now the frame can be attached loosely to the monitor just by placing on it.

After that I got a raspberry-pi and connected it to the monitor using hdmi cable and attached the raspberry pi with zip ties to the frame. All low tech till this point.
On powering up, it boots into Raspbian.

Software

Base Setup

I always get my base setup 

sudo apt-get update
sudo apt-get upgrade
sudo apt-get install xrdp # install remote desktop
sudo apt-get install vim  # my editor of choice
sudo apt-get install git

git clone https://github.com/abhinababasu/share # get my shell
cp share/.vimrc .
cp share/.bash_aliases .
cp share/.bashrc .
cp share/.bash_aliases .

sudo apt-get install unclutter # hide mouse pointer in slide show

To keep things fresh, reboot midnight every day, add the following to /etc/crontab
0  0    * * *   root    reboot

Enable ssh
sudo raspi-config

Portrait mode
1. sudo vim /boot/config.txt
2. Add the line: display_rotate=3

Push Pics

I use FrameMaker for managing photos I take. My workflow for this case is as follows

  1. All images are tagged with keyword "frame" in lightroom. 
  2. I use smart folder to see all these images and then publish to a folder named Frame in  OneDrive

Sync OneDrive to Raspberry Pi

I used the steps in https://jarrodstech.net/how-to-raspberry-pi-onedrive-sync/ 
  1. curl -L https://raw.github.com/pageauc/rclone4pi/master/rclone-install.sh | bash
  2. rclone config
    1. Enter n (for a new connection) and then press enter
    2. Enter a name for the connection (i’ll enter onedrive) and press enter
    3. Enter the number for One Drive
    4. Press Enter for client ID
    5. Press Enter for Client Secret
    6. Press n and enter for edit advanced config
    7. Enter y for auto config
    8. A browser window will now open, log in with your Microsoft Account and select yes to allow OneDrive
    9. Choose right option for OneDrive personal
    10. Now select the OneDrive you would like to use, you will probably only have one OneDrive linked to your account. This will be 0
    11. Y for subsequent questions
  3. To Sync once: rclone sync -v onedrive:Frame /home/pi/frame
  4. Setup automatic sync every one hour
    1. echo "rclone sync -v onedrive:Frame /home/pi/frame" > ~/sync.sh
    2. chmod +x ~/sync.sh
    3. crontab -e
    4. Add the line: 1 * * * * /home/pi/sync.sh

Setup Screensaver

There are many options that I could find online to show the photos. But I chose to go with the easiest one, use the xscreensaver. However, there are some issues and most likely this is something I will revisit.

  1. Disable screen blanking after some time of no use
    1. vi /etc/lightdm/lightdm.conf
    2. Addd the line[SeatDefaults]
      xserver-command=X -s 0 -dpms

  2. Enable auto-login, so that on restart you directly get logged in and then into screensaver
    1. sudo raspi-config
    2. Select 'Boot Options' then 'Desktop / CLI' then 'Desktop Autologin'. Then right arrow twice and Finish and reboot.

  3.  Setup screen saver
    1. sudo apt-get -y install xscreensaver
    2. sudo apt-get -y install xscreensaver-gl-extra

These are my screen saver settings to show the photos in /home/pi/frame as slideshow


Problems and solving with Face Detection

My photos are rarely 9:16 portraits, that means an ugly black box on the top and bottom of the images. 


Obvious approach is to crop using some batch tool. But that would mean the crop could arbitrarily cut images out. Consider the following image 
Cropping in a batch tool that picks up arbitrary area of the image generated something like below, which is obviously not acceptable.
To solve this I build a tool at https://github.com/abhinababasu/img. It takes my other project on detecting faces in images and then ensures that in the cropped image the face is retained. E.g. the tool above generates the following image.

Monday, June 15, 2020

Building Azure Monitor for SAP Solutions

The Product

Update: Here is a quick-start video
    

This post is about how we build the Azure Monitor for Sap Solutions. It is about the distributed systems we use to build database monitoring at scale for customer's data-plane. However, the first section provides a quick intro into the product itself.

"Azure Monitor for SAP Solutions" provides managed monitoring for the databases powering customer's SAP landscapes. Our monitoring supports multiple instances of databases of a particular type (e.g. HANA) and is also extendable for various kinds of databases. We have started with HANA and plan to include SQL-Server, etc. in the future. At the time of writing this post the monitoring is in  private-preview with public preview coming up "soon".

The customer uses a creation wizard on Azure portal to create the monitor as shown is the screenshot below. Customer enters their subscription, resource group, vnet details, followed by connection details of the database. Our resource provider deploys a VM payload into their vnet that connects with the database to monitor them and pumps telemetry into their Azure analytics workspace. Customers can then create dashboards and configure alerts.

Some example visualization using Workbooks on the Log Analytics Workspace to which we pump the data are as follows. We are still tweaking these and once we are in public preview I plan to come back and edit this post with links to public docs.

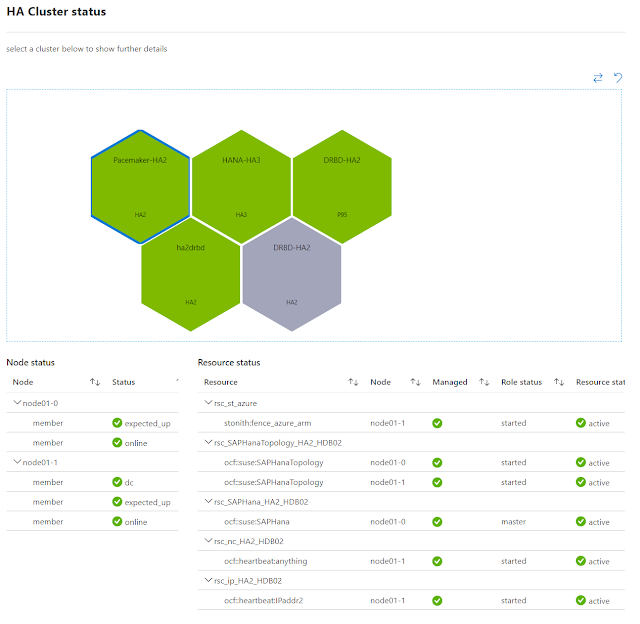
In the screenshot below the visualization shows all database clusters of our test cluster at the same place. Selecting any cluster further drills down into each DB node health.

Similarly in the following visualization we see a cluster is unhealthy and then on drilling down a node is yellow (warning state) because it is triggering our high CPU usage threshold (>50%).

Architecture 

Our product is built on Kubernetes (or rather Azure Kubernetes Service), helm, linkerd, go-lang, fluentd and similar open source software. We use the engineering principles outlined here. Also we stand on the shoulder of giants, we did not have to build many core functionality because it comes for free inside the Azure engineering umbrella. We simply onboard to internal services that provide RBAC, cross region load balancing, billing etc.

If the architecture seems familiar it is because a large part of it is shared with how we manage BareMetal blades running in memory databases (HANA) in Azure and I have posted about that here.

At the high level our architecture looks as follows.

The user/customer interacts with out system using either the Azure Portal (screenshot above), the command line tools or the SDK. We build extensions to the Azure portal for our product sub-area. All resources in azure is exposed using standardized RESTful APIs. The swagger spec is published here and the CLI and SDK is generated out of those.

All interactions of the customer is handled first by the central Azure Resource Manager (ARM). It handles authentication and RBAC. Every resource type in Azure is handled by a corresponding resource provider. In this particular case the resource is Microsoft.HanaOnAzure/sapMonitors and it is handled by the HANA-RP (also referred to as just RP for simplification in this post). ARM knows to forward calls that it gets from customers to a particular regional instance of HANA-RP after taking care of authentication and other gate keeper activities.

The regional Resource Provider or RP

For every Azure region we support we have a HANA-RP (resource provider or RP) instance deployed in that region. The RP is a collection of services that runs on Azure Kubernetes Service (AKS). HANA-RP is build mostly using go-lang and engineered through Azure DevOps. We have automated build pipeline for the RP and single click (maybe a few clicks) deployment. We use use Helm for management.

The service itself is stateless and the state is stored externally in Azure SQL Server. We use both structured data and document-DB style data. All data is replicated remotely to one more region, we configure automated backups for disaster recovery scenarios.

We do not share any state across the RP instances. This provides an important attribute we look for in Azure services, regional isolation. This ensures that in case there is a regional Azure outage it does not effect any other regions.

Each instance of RP manages all monitors in its region. When the user uses the CLI/Portal to create the monitor all the details flow over encrypted channel from the ARM into the RP. The RP then deploys the monitoring payload into customers vnet.

All data flow across pods (intra service) and across the services are encrypted in transit and the data that we store is SQL Server is also encrypted at rest. We do not store any customer secrets on our systems (more below).

Tech usage: AKS, Kubernetes, linkerd, nginx, helm, linux, Docker, go-lang, Python, SQL Server, Azure DevOps, Azure Container Repository, Azure Key-vault, etc.

Deployment

Once the RP gets a request to provision a monitor, it talks to other Azure resource providers like Compute, Storage, Security, Networking to setup the monitoring payload inside the customers vnet
  1. The RP creates various networking components (NSG, NIC)
  2. Creates storage account, storage queues
  3. Uses KeyVault to deploy DB access secrets. These are not stored by us, they remain encrypted in transit and in rest inside customer owned KeyVault
  4. Creates log-analytics workspace
  5. Creates collector VM in the resource group (a VM of type B2ms
  6. The VM uses custom script extension to bootstrap docker and pulls down the monitoring payload docker image

The Payload

Since the payload runs inside the customers vnet, we want to be absolutely transparent about what runs inside it. The entire payload is open source and can be accessed at https://github.com/Azure/AzureMonitorForSAPSolutions. Specifically at https://github.com/Azure/AzureMonitorForSAPSolutions/tree/master/sapmon/payload.

The commands use to install, launch and manage individual sub-monitors is in sapmon.py. Specific payloads are in say saphana.py or other files in that folder.

Our payload VM fetches the docker image built out of these sources from our Azure container repository from the following location
 mcr.microsoft.com/oss/azure/azure-monitor-for-sap-solutions
Once this payload starts running inside the payload-VM, it fetches database connectivity information from customer's key-vault where the RP has placed that information. It then starts querying the database to fetch various monitoring information and pumping it into the Azure telemetry pipeline. 

If the customer had opted-in during the monitor creation, the monitor also sends non identifiable telemetry back to Microsoft, so that we can ensure that the monitoring keeps functioning.

We intentionally chose a design where the monitor does not run on the database machine itself and it is isolated in a separate VM. This ensures it is easy to observe the execution of the monitor and it is easy to isolate any impact it may have on the production system of the customer.

The way our monitoring is designed (execute monitoring queries against the database to fetch monitoring information) allows it to monitor any database that is reachable from inside the customers vnet. This includes obviously databases deployed on VMs inside the vnet. In addition it can monitor customer's HANA Large Instances that are running in BareMetal blades in VLANs that are accessible over express-route. Essentially as long as the database server name is resolvable and the database on it is reachable, the monitoring system works.

Scalability

Our HANA-RP is automatically sharded by regions as it only handles all monitors in it's own region. Our stateless micro-services in each of those regions ensures we can easily horizontally scale to handle more control plane calls on the monitor in that region (create/delete monitors).

For the data-plane we actually deploy the entire payload in separate payload VMs inside the customer subscription/resource-group. So each new monitor comes with its own payload VM that monitors a DB (or a few instances of DB) for a given customer resulting in automatically scaling. The data also gets pumped into customer specific analytic workspaces and hence is not a bottleneck.

Tuesday, May 05, 2020

Using Visual Studio Codespaces


One of the pain points we face with remote development is having to go through few extra hops to get to our virtual dev boxes. Many of us uses Azure VMs for development (in addition to local machines) and our security policy is to lock down all VMs to our Microsoft corporate network.

So to ssh or rdp into an Azure VM for development, we first connect over VPN to corporate network, then use a corpnet machine to then login to the VMs. That is painful and more so now when we are working remotely.

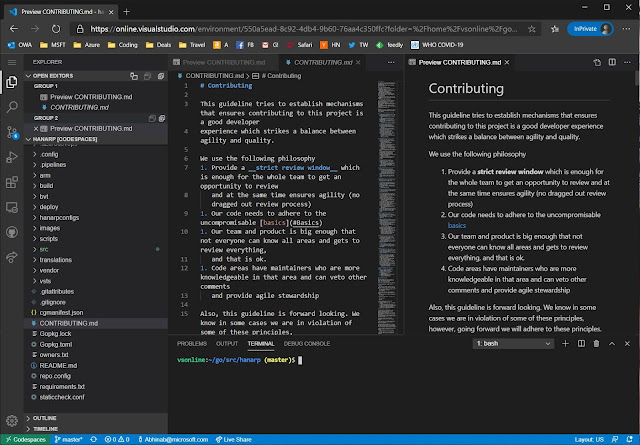
This is  where the newly announced Visual Studio Codespaces come in. Basically it is a hosted vscode in the cloud. It runs beautifully inside a browser and best of all comes with full access to the linux shell underneath. Since it is run as a service and secured by the Microsoft team building it, we can simply use it from a browser on any machine (obviously over two-factor authentication).

At the time of writing this post, the cost is around $0.17 per hour for 4 core/8GB which brings the price to around $122 max for the whole month. Codespaces also has a snooze feature. I use snooze after one hour of no usage. This does mean additional startup time when you next login, but saves even more money. In between snooze the state of the box is retained.


While just being able to use the IDE on our code base is cool in itself, having access to the shell underneath is even cooler. Hit Ctrl+` in vscode to bring up the terminal window.


I then sync'd my linux development environment from https://github.com/abhinababasu/share, installed required packages that I need. Finally I have a full shell and IDE in the cloud, just the way I want it.

To try out Codespaces head to https://aka.ms/vso-login

Sunday, April 26, 2020

Managing Baremetal blades in Azure


In this post I give a brief overview of how we run the control plane of BareMetal Compute in Azure that powers the SAP HANA Large instances (in memory database running on extreme high memory machines). We support different types of BareMetal blades that go all the way up to 24TB RAM including special memory support like Intel Optane (persistent memory) and unlike Virtual Machines, customer get full access to the BareMetal physical machine with root access but still behind network level security sandboxing.

Few years back when we started the project we faced some daunting challenges. We were trying to get custom build SAP HANA certified bare-metal machines into Azure DCs, fit them in standard Azure racks and then manage them at scale and expose control knobs to customer inside Azure Portal. These are behemoths going up to 24 TB ram and based on size different OEMs were providing us the blades, storage, networking gear and fiber-channel devices.

We quickly realized that most of the native Azure native compute stack will not work because they are built with design assumptions that do not hold for us.
  1. Azure fleet nodes or blades are built to Microsoft specification and have common denominator management API surface and monitoring, but we were bringing in disparate externally certified HW that did not meet us there
  2. Our model needed to provide customer with full root access to the bare metal blades and they were not isolated across an hyper-visor
  3. The allocator and other logic in Azure was not location aware. E.g. We had custom NetApp storage literally placed beside the high memory compute for very low latency, high throughput usage that is required by the SAP HANA in memory databases
  4. We had storage and networking requirements in terms of uptime, latency and throughput that were not met by standard Azure storage, latency and hence we had to build our own.
  5. We differed in basic layout from Azure, e.g. our blades do not have any local storage and everything runs off remote storage, we had different NW topology (many HW NICs per blade with very different I/O requirements).
Obviously we had to re-build the full cloud stack but with much more limited resources. Instead of 100s and 1000s of engineers we had a handful. So we set down a few guiding principles
  1. Be frugal on resourcing
  2. Rely on external services instead of trying to build in-house
  3. Design for maintainability
Finally 3 years in, we can see that many of our decisions and designs are holding through the test of time. We have expanded to 10s of regions around the world, added numerous scenarios but at the same time never had to significantly scale our dev resources. 

Architecture

While it might seem obvious to lot of people building these kinds of services, it was an unlikely choice for a Microsoft service. Our stack is built on Kubernetes (or rather Azure Kubernetes Service), go-land, fluentd and similar open source software. Also we stand on the shoulder of giants, we did not have to invent many core areas because it comes for free inside Azure, like RBAC, cross region balancing etc. 

At the high level our architecture looks as follows

Customer Experience


The customer interacts with out system using either the Azure Portal (screenshot above), the command line tools or the SDK. We build extensions to the Azure portal for our product sub-area. All resources in azure is exposed using standardized RESTful APIs. We publish the swagger spec here  and the CLI and SDK is generated out of those.

In any case all interactions of the customer is handled by the central Azure Resource Manager (ARM). It handles authentication, RBAC, etc. Every resource type in Azure is handled by a corresponding resource provider. In our case it is the HANA or BareMetal RP (BmRP). ARM knows (via data the BmRP provides back to it) how to forward calls that it gets from customers to a particular regional instance of BmRP.

The regional Resource Provider or RP

If we are in N Azure regions then the BmRP (resource provider) is deployed in N instances (one in each region) and it runs on Azure Kubernetes Service (AKS). BmRP is build mostly using go-lang and engineered through Azure DevOps. We have automated build pipeline for the RP and single click (maybe a few clicks) deployment. We use use Helm to manage our deployment.

The service itself is stateless and the state is stored in SQL Server Azure. We use both structured data and document-DB style json. All data is replicated remotely to one more region, we configure automated backups for disaster recovery scenarios.

We do not share any state across the RP instances. We are particular about ensuring that every regional instance can completely work on its own. This is to ensure that in case there is a regional outage it does not effect any other regions.

Each instance of RP in turn manages multiple clusters of bare-metal machines. There is one or more such clusters per RP instances. Each cluster is managed by an instance of a cluster manager (CM). All communication between RP and the cluster manager is via two Azure service-bus-queue (SBQ). One from the BmRP to the CM and the other in reverse direction. BmRP issues various commands (JSON messages) to the CM through the SBQ and gets back responses from the CM via the other SBQ.

We pump both metrics (hot-path) and logs (warm path) into our Azure wide internal telemetry pipeline called Jarvis. We then add backend alerts and dashboards on the metrics for near realtime alerting and in some cases also on the logs (using logs-to-metrics). The data is also digested into Azure Kusto (aka Data Explorer) which is a log analytics platform. The alerts tells us if something has gone wrong (severity two and above alerts ring on-call phones) and then we use the logs in Jarvis or Kusto queries to debug.

Also it's good to call out that all control flow across pods and across the services is encrypted in transit over nginx and linkerd. The data that we store is SQL Server is also obviously encrypted in transit and at rest.

Tech usage: AKS, Kubernetes, linkerd, nginx, helm, linux, Docker, go-lang,  Python, Azure Data-explorer, Azure service-bus-queue, Azure SQL Server, Azure DevOps, Azure Container Repository, Azure Key-vault, etc.

Cluster Manager

We have a cluster-manager (CM) per compute cluster. The cluster manager runs on AKS. The AKS vnet is connected over Azure Express Route into the management VLAN for the cluster that contains all our compute, storage and networking devices. All of these devices are in a physical cluster inside Azure Data-center.

We wanted to ensure that the design is such that the cluster manager can be implemented with a lot of versatility and can evolve without dependency on the BmRP. The reason is we imagined one day the cluster-manager could also run inside remote locations (edge sites) and we weren't sure if we can call into the CM from outside or have some other sort of persistent connectivity. So we chose Azure Service Bus Queue for communication using simple json command response going between BmRP and CM. This only requires that the CM can make GET calls on the SBQ end point and nothing more to talk to BmRP.

The cluster manager has two major functions

  1. Provide a device agnostic control abstraction layer to the RP
  2. Monitor various devices (compute, storage and NW) in the cluster

Abstraction

Instead of having our BmRP know specifics of all types of HW in the system, it works on an abstraction. It expects basic generic CRUD type of operations being available on those devices and issues generic commands which then the cluster-manager translates to device specific actions.

It is easier to follow through how things work if we take one specific user workflow. Say a customer wants to reboot their BareMetal blade for some reason (an Update category operation). For this the customer hits the reboot button for their blade in Azure Portal, the Portal calls into Azure Resource Manager (ARM). ARM calls into BmRP's REST Api for the same. BmRp drops the reboot blade command into the service bus queue. Finally one of the replica of the cluster-manager container that is listening for those commands pick the command up. Now for various memory sizes and types we use different blades supplied by different OEMs. Some of those blades can be controlled remotely via Redfish APIs, some support ipmi commands, some even proprietary REST apis. The job of the cluster-manager is to take the generic reboot command, identify the exact type of the blade for which the command is and then issue blade specific control commands. It then takes the response and sends it back to the RP as an ack.

Similarly for storage it can handle a get-storage-status command by servicing it with  ONTAP  (NetApp storage manager) REST Api call .

Telemetry and Monitoring

We use a fluentd based pipeline for actively monitoring all devices in the cluster. We use active monitoring, which means that not only we listen onto the various events generated by the devices in the cluster, we also call into these devices to get more information.

The devices in our cluster uses various types of event mechanism. We configure these various types of events like syslog, snmp, redfish events to be sent to the load-balancer of the AKS cluster. When one of the fluentd end-points get the event it is send through a series of input plugins. Some of the plugins filter out noisy events we do not care about, some of the plugins call back into the device that generated the event to get more information and augment the event.

Finally the output plugins send the result into our Jarvis telemetry pipeline and other destinations. Many of the plugins we use or have built are open sourced, like herehere, here and here.  Some of the critical event like blade power-state change (reboot) is sent back also through the service-bus-queue to the BmRP so that it can store blade power-state information in our database.

Generally we rely on events being sent from devices to the fluentd end point for monitoring. Since many of these events come over UDP and the telemetry pipeline itself is running on a remote (from the actual devices) AKS cluster we expect some of the events to get dropped. To ensure we have high reliability on these events, we also hence have backup polling. The cluster manager in periodic intervals reaches out to the equipment in the cluster using whatever APIs those equipment support to get their status and fault-state (if any). Between the events and backup polling we have both near real-time as well as reliable coverage.

Whether from events or from polling all telemetry is sent to our Jarvis pipeline. We then have Jarvis alerts configured on these events. E.g. if a thermal event occurs and either storage nodes or blade's temperature goes over a threshold the alert will fire. Same thing for cases like a blade crashing due to HW issues.

Tech-user: AKS, Kubernetes, linux, Docker, fluentd, Ruby, go-lang, Python, Azure service-bus-queue, snmp, ipmi, Redfish, ONTAP, syslog, etc.

Scaling and Reliability

Our front-door is Azure Resource Manager (ARM) through which all users come in. ARM has served us well and provides us with user-authentication, throttling, caching and regional load balancing. It forwards user calls for blades in one region to the RP in that region. So as we add more regions we simply deploy a new instance of the BmRP for that region, register with ARM and scale. 

Even in the same region as we land more infra we put them in new clusters with about 100-ish blades and its corresponding storage. Since each cluster has its own cluster manager with a shared nothing model, the cluster manager scales as well along with every cluster we land. As we add more scenarios in the cluster manager though we need to scale the manager itself.

Scaling the cluster manager itself is also trivial in our design, it either gets event traffic from devices or commands from BmRP over SBQ that it then executes. The events come through at the load-balancer of the AKS cluster and hence just increasing the replica count of those containers work. Commands coming from the BmRP arrives over service bus queue and all these containers listen on the same queue, so when we add more replicas of these containers the worker count goes up.

Since we use separate SBQ per CM, adding new CM automatically means new SBQ pair gets created for it. The only concern could be that we add so many new scenarios in the CM that the traffic between one CM and BmRP goes up enough to cause bottleneck in the SBQ. However, SBQ itself can be scaled up to handle it (we have never had to do that), or worst case we may have to add more SBQ, sharding by types of commands and scale it horizontally. To be honest this is not something I think will ever happen.

With all of the above we have been able to meet 99.95 uptime for our control plane and keep latencies under our target. The only place where we hit issues is connectivity with our SQL DB. We had to upscale the DB SKU in the past. We continue to infrequently hit timeouts and other issues at the DB. At one point we were talking about moving to CosmosDB as it is touted to be more reliable, but most likely we will invest in some sort of caching in the future. That can either be by deploying some sort of cache engine in the BmRP itself or most likely use Azure Redis Cache (see principles at the top of this post).
  

Monday, February 17, 2020

System Engineering Guidelines


While building our system that powers memory intensive compute in Azure we use the following engineering guidelines. We use these guidelines to build our BareMetal resource provider, cluster manager etc. These are useful principles we have accumulated from experience building various systems. What other principles do you use and recommend including?
  1. Close on broad design before sending PRs.
    1. Add design as markdown to root of the feature code path and discuss it as a PR. For broad cross RP feature it is ok to place it in the root
    2. For sizable features please have a design meeting
    3. Requirement for a design meeting is to send a pre-read and expectation is all attendees have reviewed the pre-read before coming in
  2. Be aware of distributed system quirks
    1. Think CAP theorem. This is a distributed system, network partition will occur, be explicit about your availability and consistency model in that event
    2. All remote calls will fail, have re-tries that uses exponential back-off. Log warning on re-tries and error if it finally fails
    3. Ensure we always have consistent state. There should be only 1 authoritative version of truth. Having local data that is eventually consistent with this truth is acceptable. Know the max time-period for eventual consistency
  3. System needs to be reliable, scalable and fault tolerant
    1. Always avoid SPOF (Single Point of Failure), even for absolutely required resources like SQLServer consider retrying (see below), gracefully fail and recover
    2. Have retries
    3. APIs need to be responsive and return in sub second for most scenarios. If something needs to take longer, immediately return with a mechanism to track progress on the background job started
    4. All API and actions we support should have a 99.9 uptime/success SLA. Shoot for 99.95
    5. Our system should be stateless (have state elsewhere in data-store) and designed to be cattle and not pets
    6. Systems should be horizontally scalable. We should be able to simply add more nodes to a cluster to handle more traffic
    7. Choose to use a managed service over attempting to build it or deploy it in-house
  4. Treat configuration as code
    1. Breaks due to out of band config changes are too common. So consider config deployment the same way as code deployment (Use SCD == Safe Config/Code Deployment)
    2. Config should be centralized. Engineers shouldn't be hunting around to look for configs
  5. All features must have feature flag in config.
    1. The feature flag can be used to disable features in per region basis
    2. Once a feature flag is disabled the feature should cause no impact to the system
  6. Try to make sure your system works on a single boxThis makes dev-test significantly easier. Mocking auxiliary systems is OK
  7. Never delete things immediately
    1. Don't delete anything instantaneously, especially data. Tombstone deleted data away from user view
    2. Keep data, metadata, machines around for a garbage collector to periodically delete at configurable duration.
  8. Strive to be event driven
    1. Polling is bad as the primary mechanism
    2. Start with event driven approach and have fallback polling
  9. Have good unit tests.
    1. All functionality needs to ship with tests in the same PR (no test PR later)
    2. Unit test tests functionality of units (e.g. class/modules)
    3. They do not have to test every internal functions. Do not write tests for tests' sake. If test covers all scenarios exposed by an unit, it is OK to push back on comments like "test all methods".
    4. Think what does your unit implement and can the test validate the unit is working after any changes to it
    5. Similarly if you add a reference to an unit from outside and depend on a behavior consider adding a test to the callee so that changes to that unit doesn’t break your requirements
    6. Unit test should never call out from dev box, they should be local tests only
    7. Unit test should not require other things to be spun up (e.g. local SQL server)
  10. Consider adding BVT to scenarios that cannot be tested in unit tests.
    E.g. stored procs need to run against real SqlDB deployed in a container during BVT, or test query routing that needs to run inside a web-server
  11. All required tests should be automatically run and not require humans to remember to run them
  12. Test in production via our INT/canary clusterSomethings simply cannot be tested on dev setup as they rely on real services to be up. For these consider testing in production over our INT infra.
    1. All merges are automatically deployed to our INT cluster
    2. Add runners to INT that simulate customer workloads.
    3. Add real lab devices or fake devices that test as much as possible. E.g. add fake snmp trap generator to test fluentd pipeline, have real blades that can be rebooted using our APIs periodically
    4. Bits are then deployed to Canary clusters where there are real devices being used for internal testing, certification. Bake bits in Canary!
  13. All features should have measurable KPIs and metrics.
    1. You must add metrics against new features. Metrics should tell how well your feature is working, if your feature stops working or if any anomaly is observed
    2. Do not skimp on metrics, we can filter metrics on the backend rather than not having them fired
  14. Copious logging is required.
    1. Process should never fail silently
    2. You must add logs for both success and failure paths. Err on the side of too much logging
  15. Do not rely on text logs to catch production issues.
    1. You cannot rely on too many error logs from a container to catch issues. Have metrics instead (see above)
    2. Logs are a way to root-cause and debug and not catch issues
  16. Consider on-call for all development
    1. Ensure you have metrics and logs
    2. Ensure you write good documentation that anyone in the team can understand without tons of context
    3. Add alerts with direct link to TSGs
    4. Add actionable alerts where the on-call can quickly mitigate
    5. On-call should be able to turn off specific features in case it is causing problems in production
    6. All individual merges can be rolled back. Since you cannot control when code snap for production happens the PRs should be such that it can be individually rolled back

Friday, February 14, 2020

The C Word - Part 2


Our confrontation with Lymphoma started in 2011, when the C word entered our life and my wife got diagnosed with Stage 4 Hodgkins sclerosing lymphoma. We have fought through and continue to do so. Even through she is in remission now, the shadow of Cancer still hangs over.

We had just moved across the world from India to the US in 2010 and had no family and very few friends around. We had to mostly duke it out ourselves with little support. We were able to get the best treatment available in the world through the Fred Hutch and Seattle Cancer Care Alliance. However, we do realize not everyone is fortunate to be able to do so.

Our daughter has decided to do her part now and raise funds through the Lymphoma and Leukemia Society. If you'd like to help her  please head to

https://events.lls.org/wa/SOYSeattle20/pbasu


Sunday, January 19, 2020

Chobi - Face Detection Based Static Image Gallery Generator

Over the holidays I created a simple static photo gallery generator that I named chobi. The sources are in https://github.com/abhinababasu/chobi.

Given a source folder of photos, chobi will generate a destination folder containing the original photos, generated thumbnails, css stylesheets, scripts and html files which constitute a website displaying those photos as follows


The Problem

While building chobi and also when I was looking into similar online tools, I kept hitting a major issue and that prompted further work and this post.

You see thumbnail generation from image has a major problem. I needed the gallery generator to create square thumbnails for the image strip shown at the bottom of the page. However, the generated thumbnails would simply be either from the center or some other arbitrary location. This meant that the thumbnails would cut off at weird places.

Consider the following image.

If I create a thumbnail from a tool without knowing where the face is in the image, it will generate something like
Obviously that doesn't work. So using my vanilla generator I got a website with all sorts of similar head chopped off thumbnails (marked in Red)


The Solution

Chobi uses face-detection to ensure that does not happen and the face is always fully present in the generated thumbnail. Consider the same thumbnail as above but now with face-detection

Another example of an original image and then generated thumbnail first without and then with face-detection.


With this face-detection plugged in chobi generates a much better web-site, with almost no photo cropped where it shouldn't be.

Sources

  1. Chobi sources are at https://github.com/abhinababasu/chobi
  2. It uses the face-detected thumbnail generator which I wrote at https://github.com/abhinababasu/facethumbnail
  3. That is in turn is based out of a face detection library pigo written fully in go

Sample

Checkout a gallery build using chobi at