Search

Thursday, October 05, 2017

Remote Ubuntu desktop on Azure

image

For the past many months I have moved to have my dev boxes on the cloud. I am happily using a monster Windows VM and an utility Ubuntu desktop in the cloud. I realized after talking to a few people that they don’t realize how easy it is to setup Linux remote desktop in Azure cloud. Here goes the steps.

For VM configuration I needed a small sized VM with large enough network bandwidth to support remoting. Unfortunately on Azure you cannot choose networking bandwidth but rather all the VMs in a box gets networking bandwidth proportional to the number of cores they have. So I just created a VM based on the “Standard DS4 v2 Promo (8 vcpus, 28 GB memory)” and connected it to Microsoft ExpressRoute. If you are ok with public IP you skip setting the express route and ensure your VM has a public IP.

Then went to the Portal and enabled RDP. For that in the portal choose VM –> Networking and add rule to enable RDP.

image

Finally I sshed into my VM with

c:\bin\putty.exe abhinaba@AbhiUbuntu

Time to now install a bunch of tools

sudo apt-get update
sudo apt-get install xrdp
sudo apt-get install ubuntu-desktop
sudo apt-get install xfce4
sudo apt-get update

Setup xsession

echo xfce4-session > ~/.xsession

Open the following file

sudo gvim /etc/xrdp/startwm.sh

Set the content to

#!/bin/sh

if [ -r /etc/default/locale ]; then
    . /etc/default/locale
    export LANG LANGUAGE
fi

startxfce4

start the xrdp service

sudo /etc/init.d/xrdp start

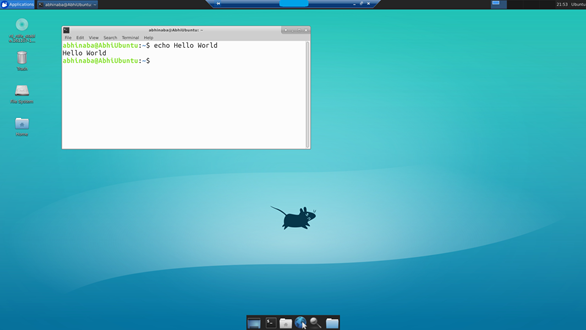
And then from my windows machine mstsc /v:machine_ip. I am presented with the login screen

image

then I have full Ubuntu desktop on Azure :)

image

Wednesday, September 13, 2017

Distributed Telemetry at Scale

image

In Designing Azure Metadata Service I elaborated on how we run Azure Instance Metadata Service (IMDS) at massive scale. Running at this scale in 36 regions (at the time of writing) of the world, on incredible number of machines is a hard problem to solve in terms of monitoring and collecting telemetry. Unlike other centralized services it is not as simple as connecting it to a single telemetry pipeline and get done with it.
We need to ensure that
  1. We do not collect too much data (cost/latency)
  2. We do not collect too less (hard to debug issues)
  3. Data collection is fast
  4. We are able to drill down into specific issues and areas of problem
  5. Do all of the above when running in 36 regions of the world
  6. Continue to do all of the above as Azure continues it’s phenomenal growth
To meet all the goals we take a three pronged approach. We break out telemetry to 3 paths
  1. Hot-path: Minimal numeric data that can be uploaded super fast (few second delayed) that we can use for monitoring our service and alert in case anomaly is detected
  2. Warm-path: More richer textual data that are few minute delayed and we can use this to drill down into issues remotely in case hot-path flagged an issue
  3. Cold-path: This gives us full fidelity data to monitor
image

Hot-Path

Even though we run on so many places we want to ensure that we have near real time alerting and monitoring and can quickly catch if something bad is happening. For that we use performance and functionality counters. These counters measure the type of response we are giving back, their latencies, data size etc. All of them are numeric and track each call in progress. We then have high speed uploaders in each machine with backends that can collect these. Then we attach these counters with alerts at per cluster level. We can catch latency issues, failures with few seconds delays. These counters only tell us if something is going bad and not why they are doing so. We have 10s of such numeric high speed telemetry coming from each IMDS instance.
Here’s a snapshot of one such counter in our dashboard showing latency at 90th percentile.
image
In addition we have external dial-tone services that keep pinging IMDS to ensure the services are up everywhere. If there is no response then likely there has been some crash or other deadlocks. We measure the dial-tone as part of our up-time and also have alerts tied to this.
image

Warm-Path

If hot-path counter driven alerts tell us something has gone wrong and an on-call engineer is awaken, the next steps of business is to quickly figure out what’s going on. For that we use our warm-path pipeline. This pipeline uploads informational and error level logging. Due to volume the data is delayed by few minutes. The query granularity can also slow down fetching them. So one of the focus of the hot-path counters is that it can narrow down the location of problem to cluster level/machine level.
The alert directly filters the logs being uploaded to a cluster/machine and brings up all logs. In most cases they are sufficient for us to detect issues. In case that doesn’t work we need to go into the detailed logs.
Cold-Path
Every line of logs (error/info/verbose) our service creates is stored locally on the machines with a certain retention policies. We have built tools so that given an alert an engineer can run a command from his dev box to fetch the log directly from that machine, wherever in the world the machine with the log exists. For hard to debug issues this is the last recourse.
However, more cooler is that we use our CosmosDB offering as a document store and store all error and info logs into that. This ensures the logs remain query-able for a long time (months) for reporting and analysis. We also run jobs that read the logs from these cosmos streams and then shove it into Kusto as structured data. Kusto is also available to users with the more fancier name of Azure Application Insights Analytics. I was floored with the insight we can get with this pipeline. We upload close to 8 terabytes of log data a day into cosmos and still able to query all data over months in a few seconds
Here’s a quick peek into seeing what kind of responses IMDS is handing out.
image
A look into the kinds of queries coming in.
image
Distribution of IMDS version being asked for.
image
We can extract patterns from the logs, run regex matching and all sorts of cool filters and at the same time be able to render data across our fleet in seconds.

Monday, September 11, 2017

Designing Azure Metadata Service

image

Some time back we have announced the general availability of Azure Instance Metadata Service (IMDS). IMDS has been designed to deliver instance metadata information into every IaaS virtual machines running on Azure over a REST endpoint. IMDS works as a data aggregation service and fetches data from various sources and surfaces it to the VM in a consistent manner. Some of the data can already be on the physical machine running the VM and others could be inside other regional service which are remote from the machine.

As you can imagine the scale of usage of this service is immense and spans across globe (at the time of writing 36 regions across the world) and Azure usage doubles YoY. So any design for IMDS has to be highly scalable and built for future growth.

We had many options to build this service both based on the various reliability parameters we wanted to hit as well as in terms of engineering ease.

image

Given a typical cloud hierarchical layout, you can imagine such a service to be built in any one of the following ways

  1. Build it like any other cloud service that runs on its own IaaS or PaaS infrastructure, with load-balancers, auto-scaling, mechanisms for distributing across regions, sharding etc.
  2. Dedicate machines in clusters or data centers that run this service locally
  3. Run micro-services directly in the physical machines that host the VMs

Initially building a cross region managed service seems like a simpler choice. Pick up any of the standard REST stack, deploy using any of the many deployment models available in Azure and go with that. With auto-scaling, load balancers it should just work and scale.

Like with any distributed systems we looked into our CAP model.

  1. Consistency: We could live with a more relaxed eventual consistency model for metadata. You can update the metadata of a virtual machines by making changes to it in the portal or using Azure CLI and eventually the virtual machine gets this last updated value
  2. Availability: The data needs to be highly available because various key pieces in the azure internal stack takes dependency on this metadata along with customer code running inside the VM
  3. Partition: The network is highly partitioned as is evident from the diagram above

Metadata of virtual machines is updated less frequently, however is used heavily across the stack (reads are much more common than updates). We needed to guarantee very high availability over a very highly partitioned infrastructure. We chose to optimize on partition tolerance and availability with eventual consistency. With that having a regional service was immediately discarded because it is not possible to provide high enough availability with that model.

Coupled with the above requirements and our existing engineering investments we chose to go with approach #3 of running IMDS as a micro service on each Azure host machine.

  1. Data is fetched and cached on every machine, which means that data is lower in liveliness but is always eventually consistent as data gets pushed into those machines. Varying levels of liveliness exists based on what specific source the metadata is fetched from. Some metadata anyway needs to be pushed into the machine before it is applied and is hence always live, others like say VM tags has lower liveliness guarantee
  2. Since the data is served from the same physical machine, the call doesn’t leave the machine at all and we can provide very high availability. Other than ongoing software deployments and system errors the data is always available. There is no network partition.
  3. There is no need to further balance load or shard out data because the data is on the machine where it is being served. The solution automatically scales with Azure because more customers means more Azure machines running them and more placed IMDS can run on
  4. However, deploying and telemetry at this scale is tough. Imagine how large Azure deployment is and consider deploying and updating a service that runs everywhere on it.

It’s really fun working on problems on this scale and it’s always a learning experience. I look forward to share more details on my blog here.

Friday, September 08, 2017

Azure Instance Metadata Service

image

One of the projects in Microsoft Azure that I have been involved with is the instance metadata service (IMDS) for Azure. It’s a massively distributed service running on Azure that among other things brings metadata information to IaaS virtual machines running on azure.

IMDS is documented at https://aka.ms/azureimds. Given that the API is already well documented at that location and like all services will evolve to encompass more scenarios in the future, I would not repeat that effort here. Rather I wanted to cover the background behind some of the decisions in the API design.

First lets look at the API itself and break it down to it’s essential elements

D:\>curl -H Metadata:True "http://169.254.169.254/metadata/instance?
api-version=2017-04-02&format=text" compute/ network/

Metadata API is REST based and available over a GET call at the non-routable IP address of 169.254.169.254. This IP is reserved in Azure for some time now and is also used for similar reasons in AWS. All calls to this API has to have the header Metadata:True. This ensures that the caller is not blindly forwarding an external call it received but is rather deliberately accessing IMDS.

All metadata is rooted under /metadata/instance. In the future other kinds of publicly available metadata could be made available under /metadata.

The Api-versions are documented in the link shared above and the caller needs to explicitly ask for a version, e.g. 2017-04-02. Interestingly it was initially named 2017-04-01, but someone in our team thought that it’s not a great idea to ship the first version of an API based on April fools day.

We did consider supporting something like “latest”, but experience tells us that it leads to fragile code. As versions will be updated, invariably some user’s scripts/code depending on latest to be of some form breaks. Moreover, it’s hard from our side to also gauge what versions are being used in the wild as users may just use latest but have implicit dependency on some of the metadata values.

We support two formats, JSON and text. On using JSON you can fetch the entire metadata and parse it on your side. A sample from Powershell screen shot is shared below.

image

However, we wanted to support a simple text based approach as well. It’s easiest to imagine the metadata as a DOM (document object model) or even a directory. On asking for text format at any level (the root being /metadata/instance) the immediate child data is returned. In the sample above the top level compute and network is returned. They are each in a given line and if that line ends with a slash, it indicates that the data has more children. Since compute/ was returned we can fetch it’s children by the following.

D:\>curl -H Metadata:True "http://169.254.169.254/metadata/instance/compute?api-version=2017-04-02
&format=text" location name offer osType platformFaultDomain platformUpdateDomain publisher sku version vmId vmSize

None of them have a “/” suffix and hence they are all leaf level data. E.g. we can fetch the unique id of the VM and the operating system type with the following calls

D:\>curl -H Metadata:True "http://169.254.169.254/metadata/instance/compute/vmId?
api-version=2017-04-02&format=text" c060492e-65e0-40a2-a7d2-b2a597c50343
D:\>curl -H Metadata:True "http://169.254.169.254/metadata/instance/compute/osType?
api-version=2017-04-02&format=text" Windows

The entire idea being that the API is usable from callers like bash-scripts or other cases that doesn’t want or need to pull in a JSON parser. The following bash script pulls the vmId from IMDS and displays it

vmid=$(curl -H Metadata:True "http://169.254.169.254/metadata/instance/compute/vmId?
api-version=2017-04-02&format=text" 2>/dev/null) echo $vmid

I have shared a few samples of using IMDS at https://github.com/bonggeek/Samples/tree/master/imds

Do share feedback and requests using the URL https://aka.ms/azureimds