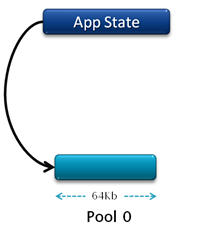
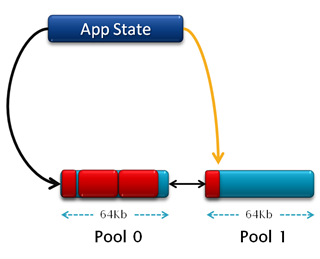
As I mentioned in one of my previous posts the .NET Compact Framework uses 5 separate heaps of which one is dedicated for managed data and is called the managed heap. The .NETCF allocator, allocates pools of data from this managed heap and then sub-allocates managed objects from this pool.
This is how the process goes
The first question I get asked at this point is what happens when one object itself is bigger than 64Kb :). The answer is that the CLR considers such objects as “huge-objects” and they are placed in their own obj-pool. This essentially means that either obj-pools are 64Kb in size and has more than one object in them or are bigger than 64Kb and has only one huge-object in it.
Object allocation speed varies a lot between whether it is being allocated from the current pool (where it is just the cost of a pointer increment) or it needs a new pool to be allocated (where there is additional cost of a 64Kb allocation). On the average managed objects are 35 bytes in size and around 1800 can fit in one pool and hence on the whole allocation speed attained is pretty good.
Verifying what we discussed above
All of the things I said above can be easily verified using the Remote Performance monitor. I wrote a small application that allocates objects in a loop and launched it under Remote Performance monitor and published the data to perfmon so that I can observe how the managed heap grows. I used the process outlined in Steven Pratschner’s blog post at http://blogs.msdn.com/stevenpr/archive/2006/04/17/577636.aspx
Using the above mentioned mechanism I am observing the managed bytes allocated (green line) and the GC Heap (red line). You can see that the green line increases linearly and after every 64Kb the red line or the GC Heap bumps up by 64Kb as we allocate a new object pool from the heap.


